> ## Documentation Index
> Fetch the complete documentation index at: https://docs.minoa.io/llms.txt
> Use this file to discover all available pages before exploring further.
# Measurements
> Record monthly metric values and track realized benefit over time
Recording measurements is where value realization comes to life. Each month, you enter the actual metric values from your customer's business—and the system calculates the real benefit delivered, compares it against projections, and builds a visual story of value over time.
**Think of it this way:** You need inputs set up to accept values over time (often via [monthly
values](/pages/value-realization/measurements#recording-measurements) or the optional [conversion
helper](/pages/value-realization/converting-calculations)). Recording measurements fills in the real numbers that
prove ROI. Conversion is **not** required for that—only the right input configuration for your model.
If your organization connects a **data warehouse** feed, Minoa can **sync metrics** from that source on a schedule and **automatically populate** these inputs—see [Data ingestion](/pages/integrations/data-platforms/introduction).
## How time-series inputs work
For each metric you track month by month, that input behaves as a **time-series input**—it can hold a different value for each month of the contract. You might get there through the optional [conversion](/pages/value-realization/converting-calculations) flow, by editing the calculation directly, or by enabling time-series on an input without conversion—see [Converting Calculations](/pages/value-realization/converting-calculations) for when the guided flow applies.
**Key behavior: values carry forward.** When you enter a value for a given month, that value automatically applies to all subsequent months until you change it. This means you only need to update when the measurement actually changes.
**Example:** You enter "115 tickets per day" for October. That value stays in effect for November, December, and beyond—until you enter a new measurement.
Each value you enter defines the metric from that month forward, until the next entry overrides it. You don't need
to fill in every single month.
## Recording measurements
### Entering values in the calculation view
With your Value Realization Scenario active, navigate to any use case's calculation. Each time-series input has a collapsible section—click the arrow to the left of the input name to expand it and reveal a vertical list of months, each with its own editable row in a scrollable surface.
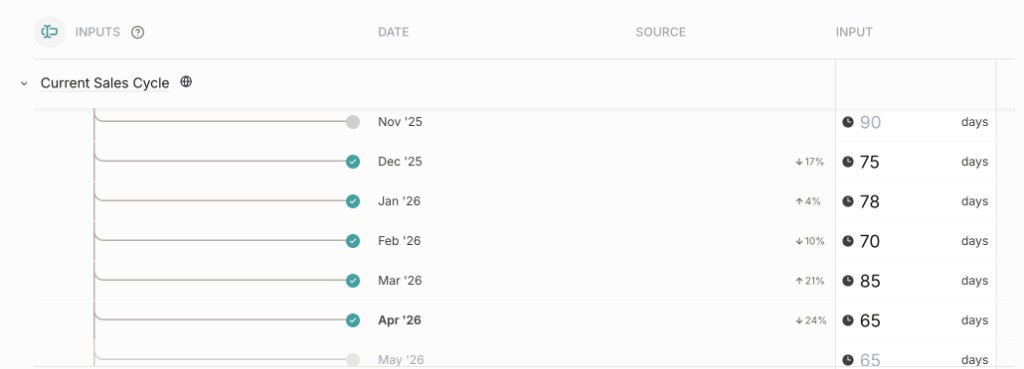
Use the scenario selector at the top of your business case to switch to your Value Realization Scenario.
Navigate to the calculation view for the use case you want to update.
Click the arrow next to the improvement metric name to expand it. You'll see a row for each month of the
contract period.
Click the row for the month you're updating and type the value. The benefit calculation updates in real time.
Measurements are saved automatically as you type.
### Entering past measurements
Need to backfill historical data? You can enter values for any month in the contract period:
1. Navigate to the tracked metric row in the calculation view
2. Click the cell for the past month you want to update
3. Enter the value (it saves automatically as you type)
4. All benefit calculations from that month forward recalculate based on the new data
**Pro tip:** When you first create a Value Realization Scenario, go back and enter measurements for any months that
have already passed. This immediately populates the Value Summary with historical realized value.
## The Value Summary
The **Value Summary** is your main dashboard for tracking realized value. It shows a comprehensive picture of what's been achieved—and, when you choose, how that compares to the original estimate.
### What the Value Summary shows
When you have a Value Realization Scenario active, the Value Summary displays:
The headline number: total benefit calculated from your measurements, up to the current month. This is the "so
far" number you lead with in customer conversations.
When a future scenario can be paired with your Value Realization period, a cumulative chart can show realized
alongside estimated value. You can turn the estimate on or off (see below). If no comparison is available, you
still see realized benefit over time.
Each use case shows its individual realized benefit and how far along it is relative to the projection. Quick
scan to see which use cases are outperforming and which need attention.
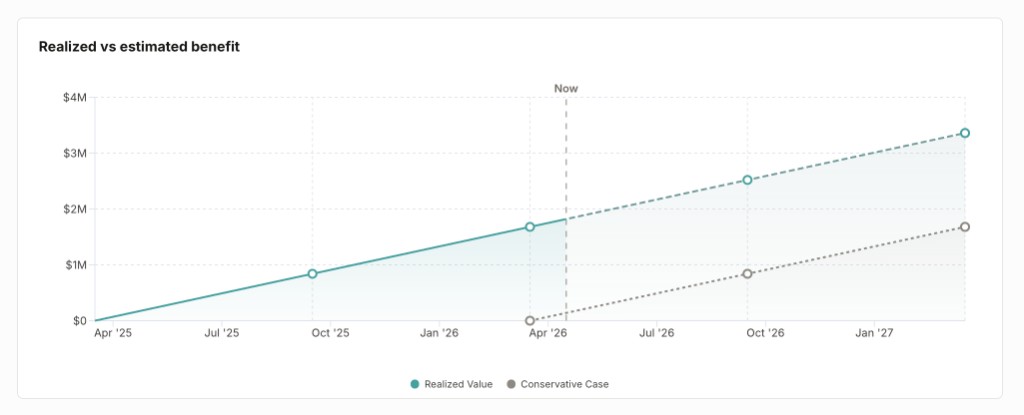
### Controlling the comparison
**You do not have to compare to the original estimate.** Totals, use-case rows, and your realized curve stand on their own. Comparison is a narrative choice when a valid future scenario exists.
On the stacked **benefit over time** chart on the Value Summary, open **Chart settings** (gear icon) and use **Show estimated value** to toggle the estimated curve from a future scenario on or off. With it off, you lead with **realized value only**—useful for proof-of-impact conversations without anchoring to the pre-sales projection.
**If the option is disabled** (“Add another scenario first”), the product does not have a future scenario it can pair for that comparison. You are still tracking realized value correctly; add or align a **future** scenario that overlaps the Value Realization contract window if you want both curves.
The **Chart settings** on the Value Summary apply to **this business case**—the scenario selector at the top of the
page determines which scenario you are viewing.
Typical reasons to show or hide the estimate:
* **Show it** during internal reviews to understand tracking progress against the plan
* **Hide it** when presenting to the customer if realized value is significantly below projections (you can always re-enable it later), or whenever you want the story to center on **what was achieved**, not variance to the model
### Interpreting the chart
When both curves appear, the realized vs. estimated comparison tells a powerful story:
**Realized above estimated:** Your customer is getting more value than projected. Celebrate this in QBRs and use it to support expansion conversations.
**Realized tracking estimated:** Projections were accurate. The business case was well-built, and rollout is on track.
**Realized below estimated:** Value delivery is lagging. Use this as a trigger for proactive conversations with your champion about adoption, process changes, or timeline adjustments.
**Realized value only (no estimated curve):** Lead with headline totals and the trajectory of realized benefit. Month-over-month momentum still tells a strong story for QBRs and renewals.
## Getting data from your customer
Recording measurements requires ongoing collaboration with your customer. Here are proven approaches:
### Set up regular data sharing
Get read-only access to relevant customer dashboards or reporting tools where metrics are tracked.
Schedule a recurring 15-minute call with your champion to review and confirm measurements together.
### When data isn't available
Sometimes you won't have perfect data for every month. Here's how to handle it:
If you need to estimate, err on the low side. The carry-forward behavior means an estimate will persist until
you enter a real number—so keep it conservative.
Got data for 2 out of 3 weeks in the month? Calculate the average and plan to update when the full data set is
available.
If you have no data, simply don't enter a value. The previous month's value carries forward, so your
calculations won't break. Come back and update when real data is available.
When data becomes available, go back and update any month. The calculations adjust retroactively from that point
forward.
**Never fabricate data:** Your credibility depends on honest, customer-confirmed measurements. If you don't have
data, let the carry-forward value hold until real numbers are available.
## Interpreting trends
As you record measurements over time, patterns emerge. Here's how to read them:
### Positive trends
**Steady climb:** Measurements improve month-over-month.
**What it means:** Your product is delivering value as expected. Rollout and adoption are progressing well.
**Your action:** Document what's working. Use this story in other deals.
**Accelerating improvement:** Rate of improvement increases over time.
**What it means:** Customer is hitting their stride with your product. Network effects or scale may be kicking in.
**Your action:** Identify what caused the acceleration. Can you replicate it with other customers?
### Concerning trends
**Flat line:** No improvement over several months.
**What it means:** Adoption may have stalled. Users might not be engaging with the feature, or there's a technical issue.
**Your action:** Schedule a check-in with your champion. Review [milestones](/pages/value-realization/milestones) and usage data to diagnose the issue.
**Declining values:** Measurements are getting worse.
**What it means:** Something changed—maybe a process, personnel, or competing priority. This is a renewal risk.
**Your action:** Immediate customer conversation. Understand what changed and develop a plan to get back on track.
**Volatile/spiky:** Wild swings month-to-month.
**What it means:** Data quality issues, seasonal effects, or inconsistent measurement sources.
**Your action:** Standardize your data collection process.
**Use the Value Summary chart as a conversation starter:** When you see an unexpected trend, don't wait—reach out
to your customer champion to understand what's happening.
## Measurement best practices
Measure the same way every month. Don't switch from "weekly average" to "monthly total" midway through.
Keep a record of where each measurement came from. Future you (or your successor) will be grateful.
Record the actual data, even if it's not flattering. Honest tracking builds trust and helps you improve.
Before a QBR or renewal discussion, scan the Value Summary for anomalies or missing data. Fill gaps or prepare
explanations.
## Presenting measurements to customers
Your Value Summary is most powerful when you share it with your customer regularly.
### Quarterly business reviews
1. **Show the chart:** Lead with the realized vs. estimated comparison chart showing improvement over time
2. **Highlight milestones:** Connect measurement improvements to specific [milestones](/pages/value-realization/milestones) or rollout phases
3. **Celebrate wins:** Call out months where metrics exceeded expectations
4. **Be honest about challenges:** If a metric is flat or declining, acknowledge it and discuss next steps
### Renewal discussions
1. **Total realized benefit:** Start with the big number from the Value Summary—total benefit delivered across all use cases
2. **Compare to projection:** The realized vs. estimated chart makes this comparison automatic and visual
3. **ROI calculation:** Present the ROI based on actual measurements, not projections
4. **Tell the full story:** Combine the Value Summary with [milestones](/pages/value-realization/milestones) to show both financial impact and implementation progress
**Frame it as their success:** "Your team handled 158 tickets per day by March—that's a 58% improvement and \$109,000
in realized benefit."
## Troubleshooting
1. Check that you entered the value in the correct unit (e.g., daily not monthly)
2. Review all inputs in the calculation—an incorrect unit or cost input can throw off the result
3. Verify the conversion was set up correctly (right improvement metric selected)
4. If still wrong, try [reverting the conversion](/pages/value-realization/converting-calculations#reverting-a-conversion) and reconverting with the correct metric
This is by design—each value you enter persists for all following months until you override it with a new entry.
If a metric genuinely dropped to zero or changed significantly, enter the new value for that month to override
the carry-forward.
Check that:
* You're viewing the Value Realization Scenario (not a future scenario)
* Inputs that should drive realized benefit are set up to accept measurements (time-series or otherwise)—lack
of conversion alone does not block tracking if the calculation is configured correctly
* At least one month has a measured value entered (or a valid static realized input, depending on your setup)
* The contract start date on the Value Realization Scenario is correct
Make sure the month falls within the Value Realization Scenario's contract period. Months outside the contract
start and end dates won't have editable cells.
Measurements flowing in? Combine them with [milestone tracking](/pages/value-realization/milestones) to tell the
complete story of value delivery—both the financial impact and the implementation journey.