Name and describe your calculation
Give your calculation a clear name and description that explains the value story.
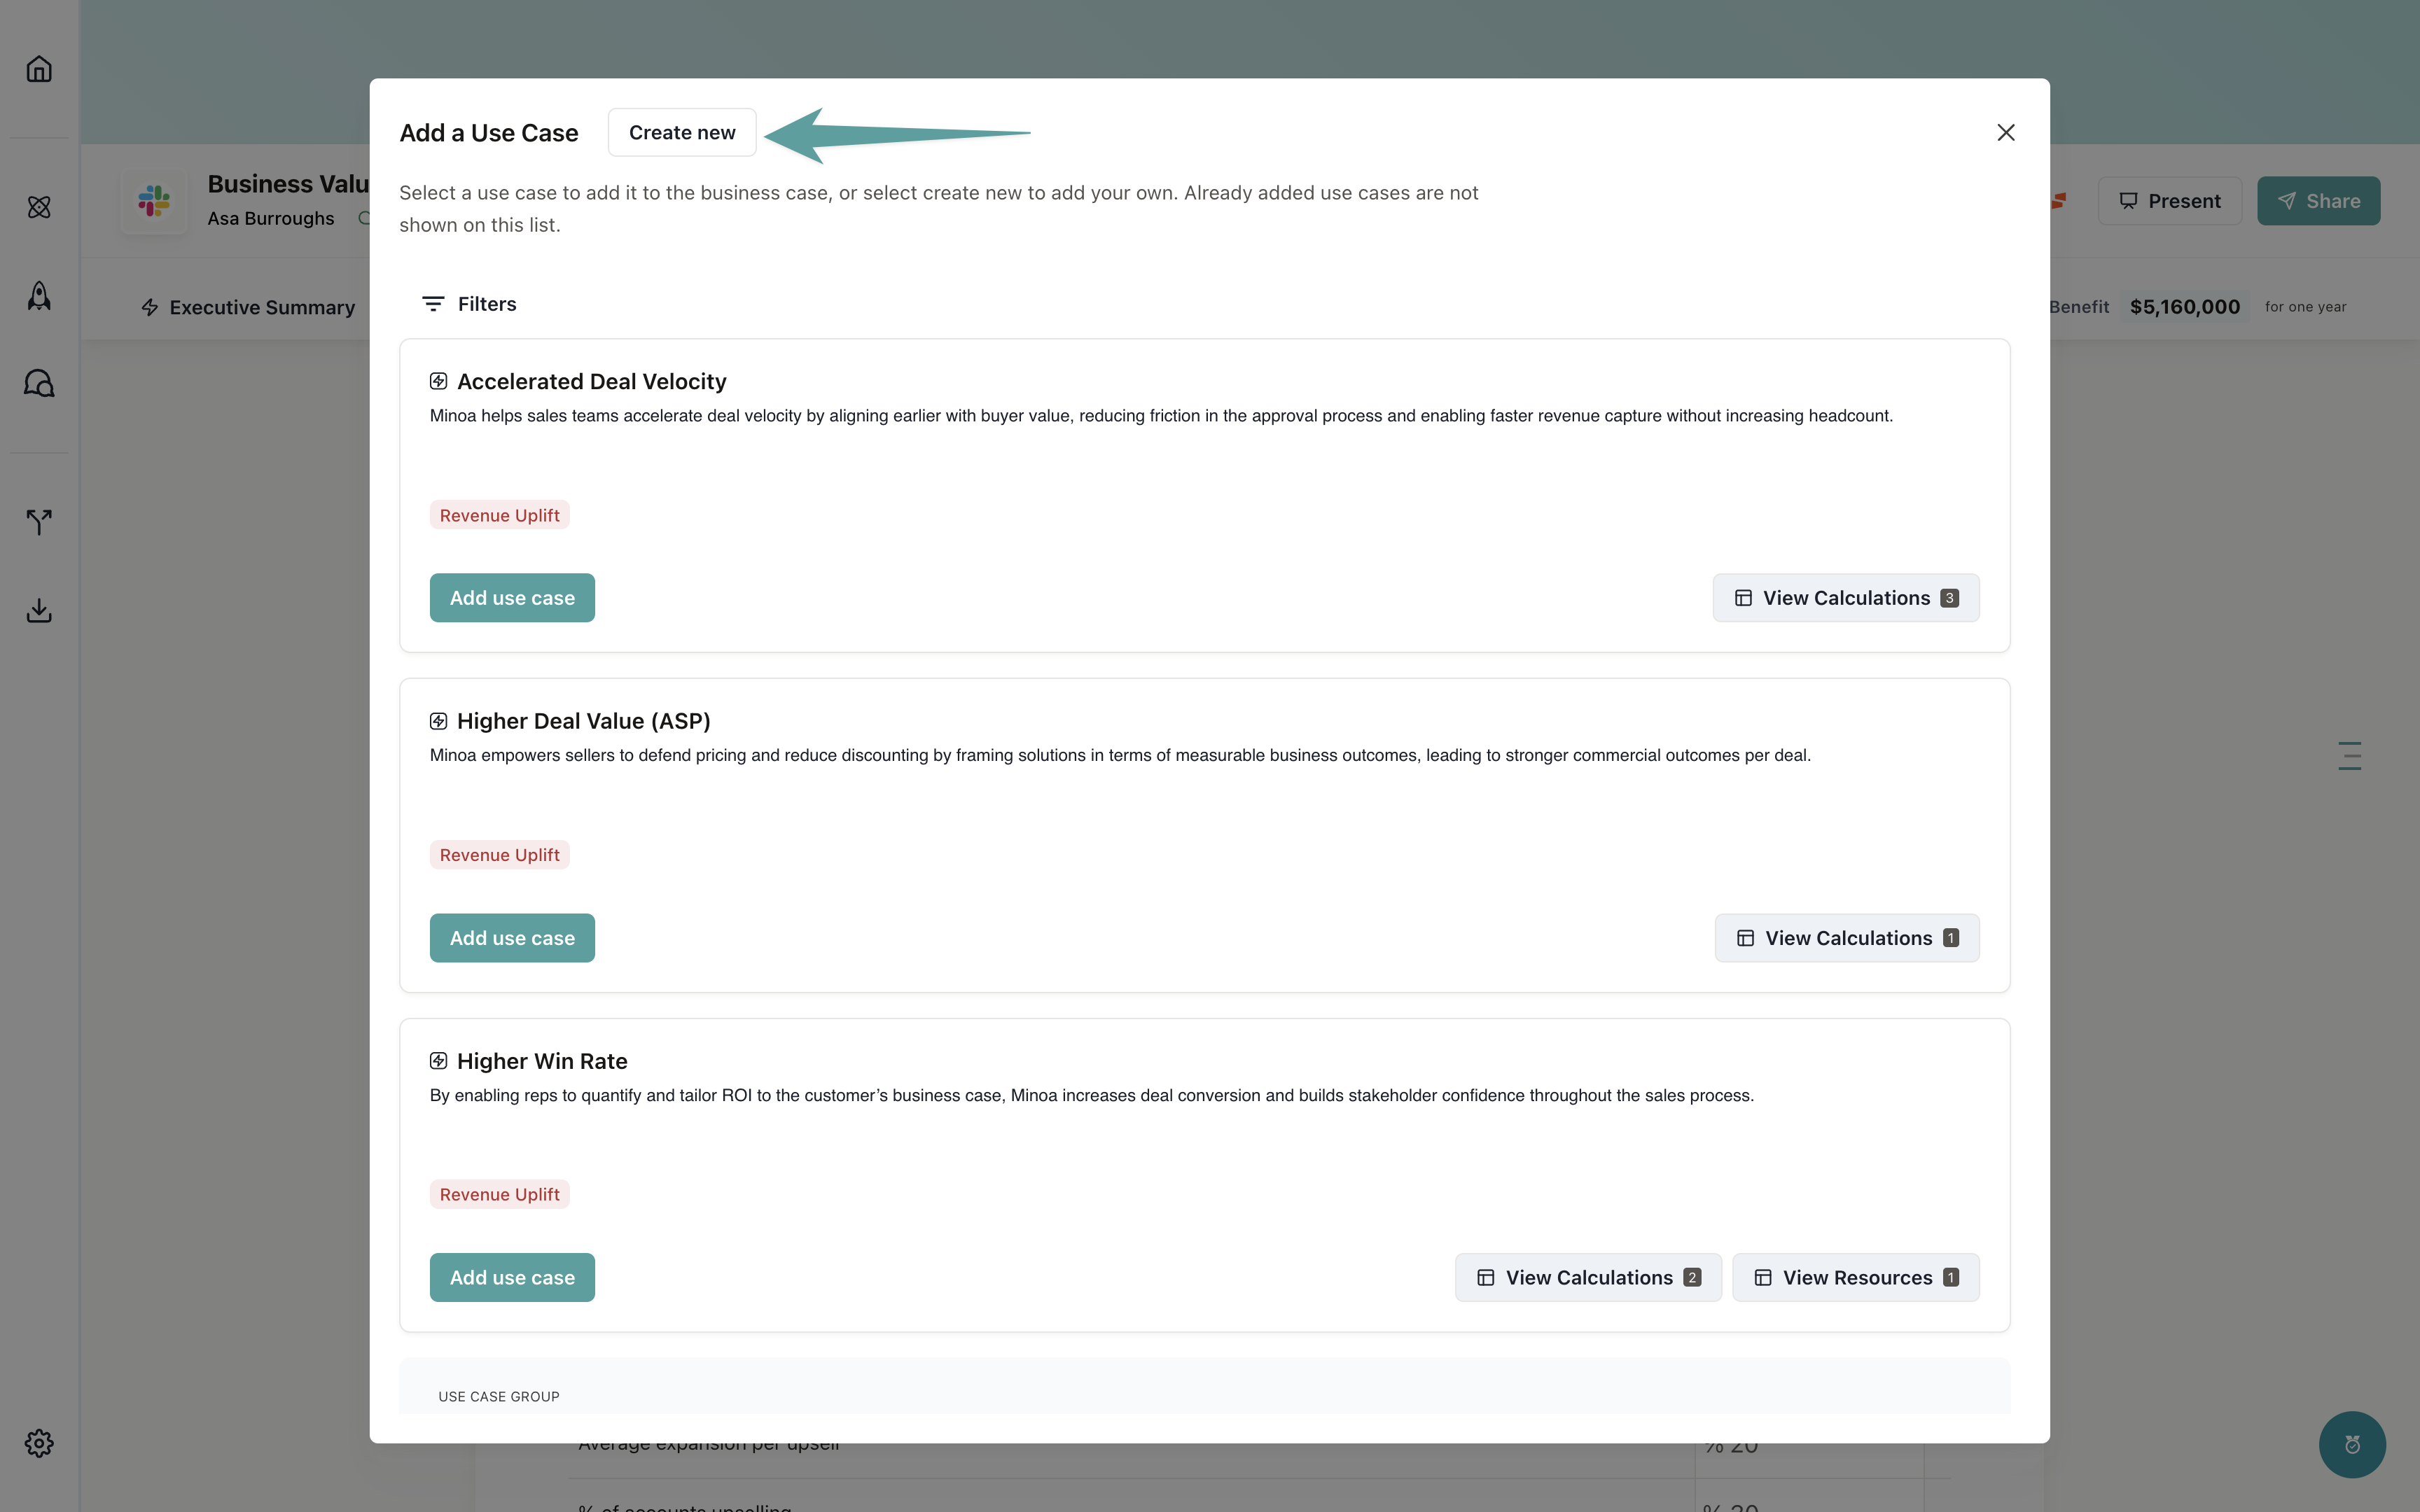
Create a new use case
You can add a calculation to an existing use case or create a new one. For this recipe, we’ll create a new use case.- Navigate to the Value Summary tab of your business case
- Click Add Use Case
- Enter a name for your use case (e.g., “Reduce Time on Task”)
- Add a description that explains the value outcome
Use cases can contain multiple calculations. You might have one use case with several related calculations that
together tell a complete value story.
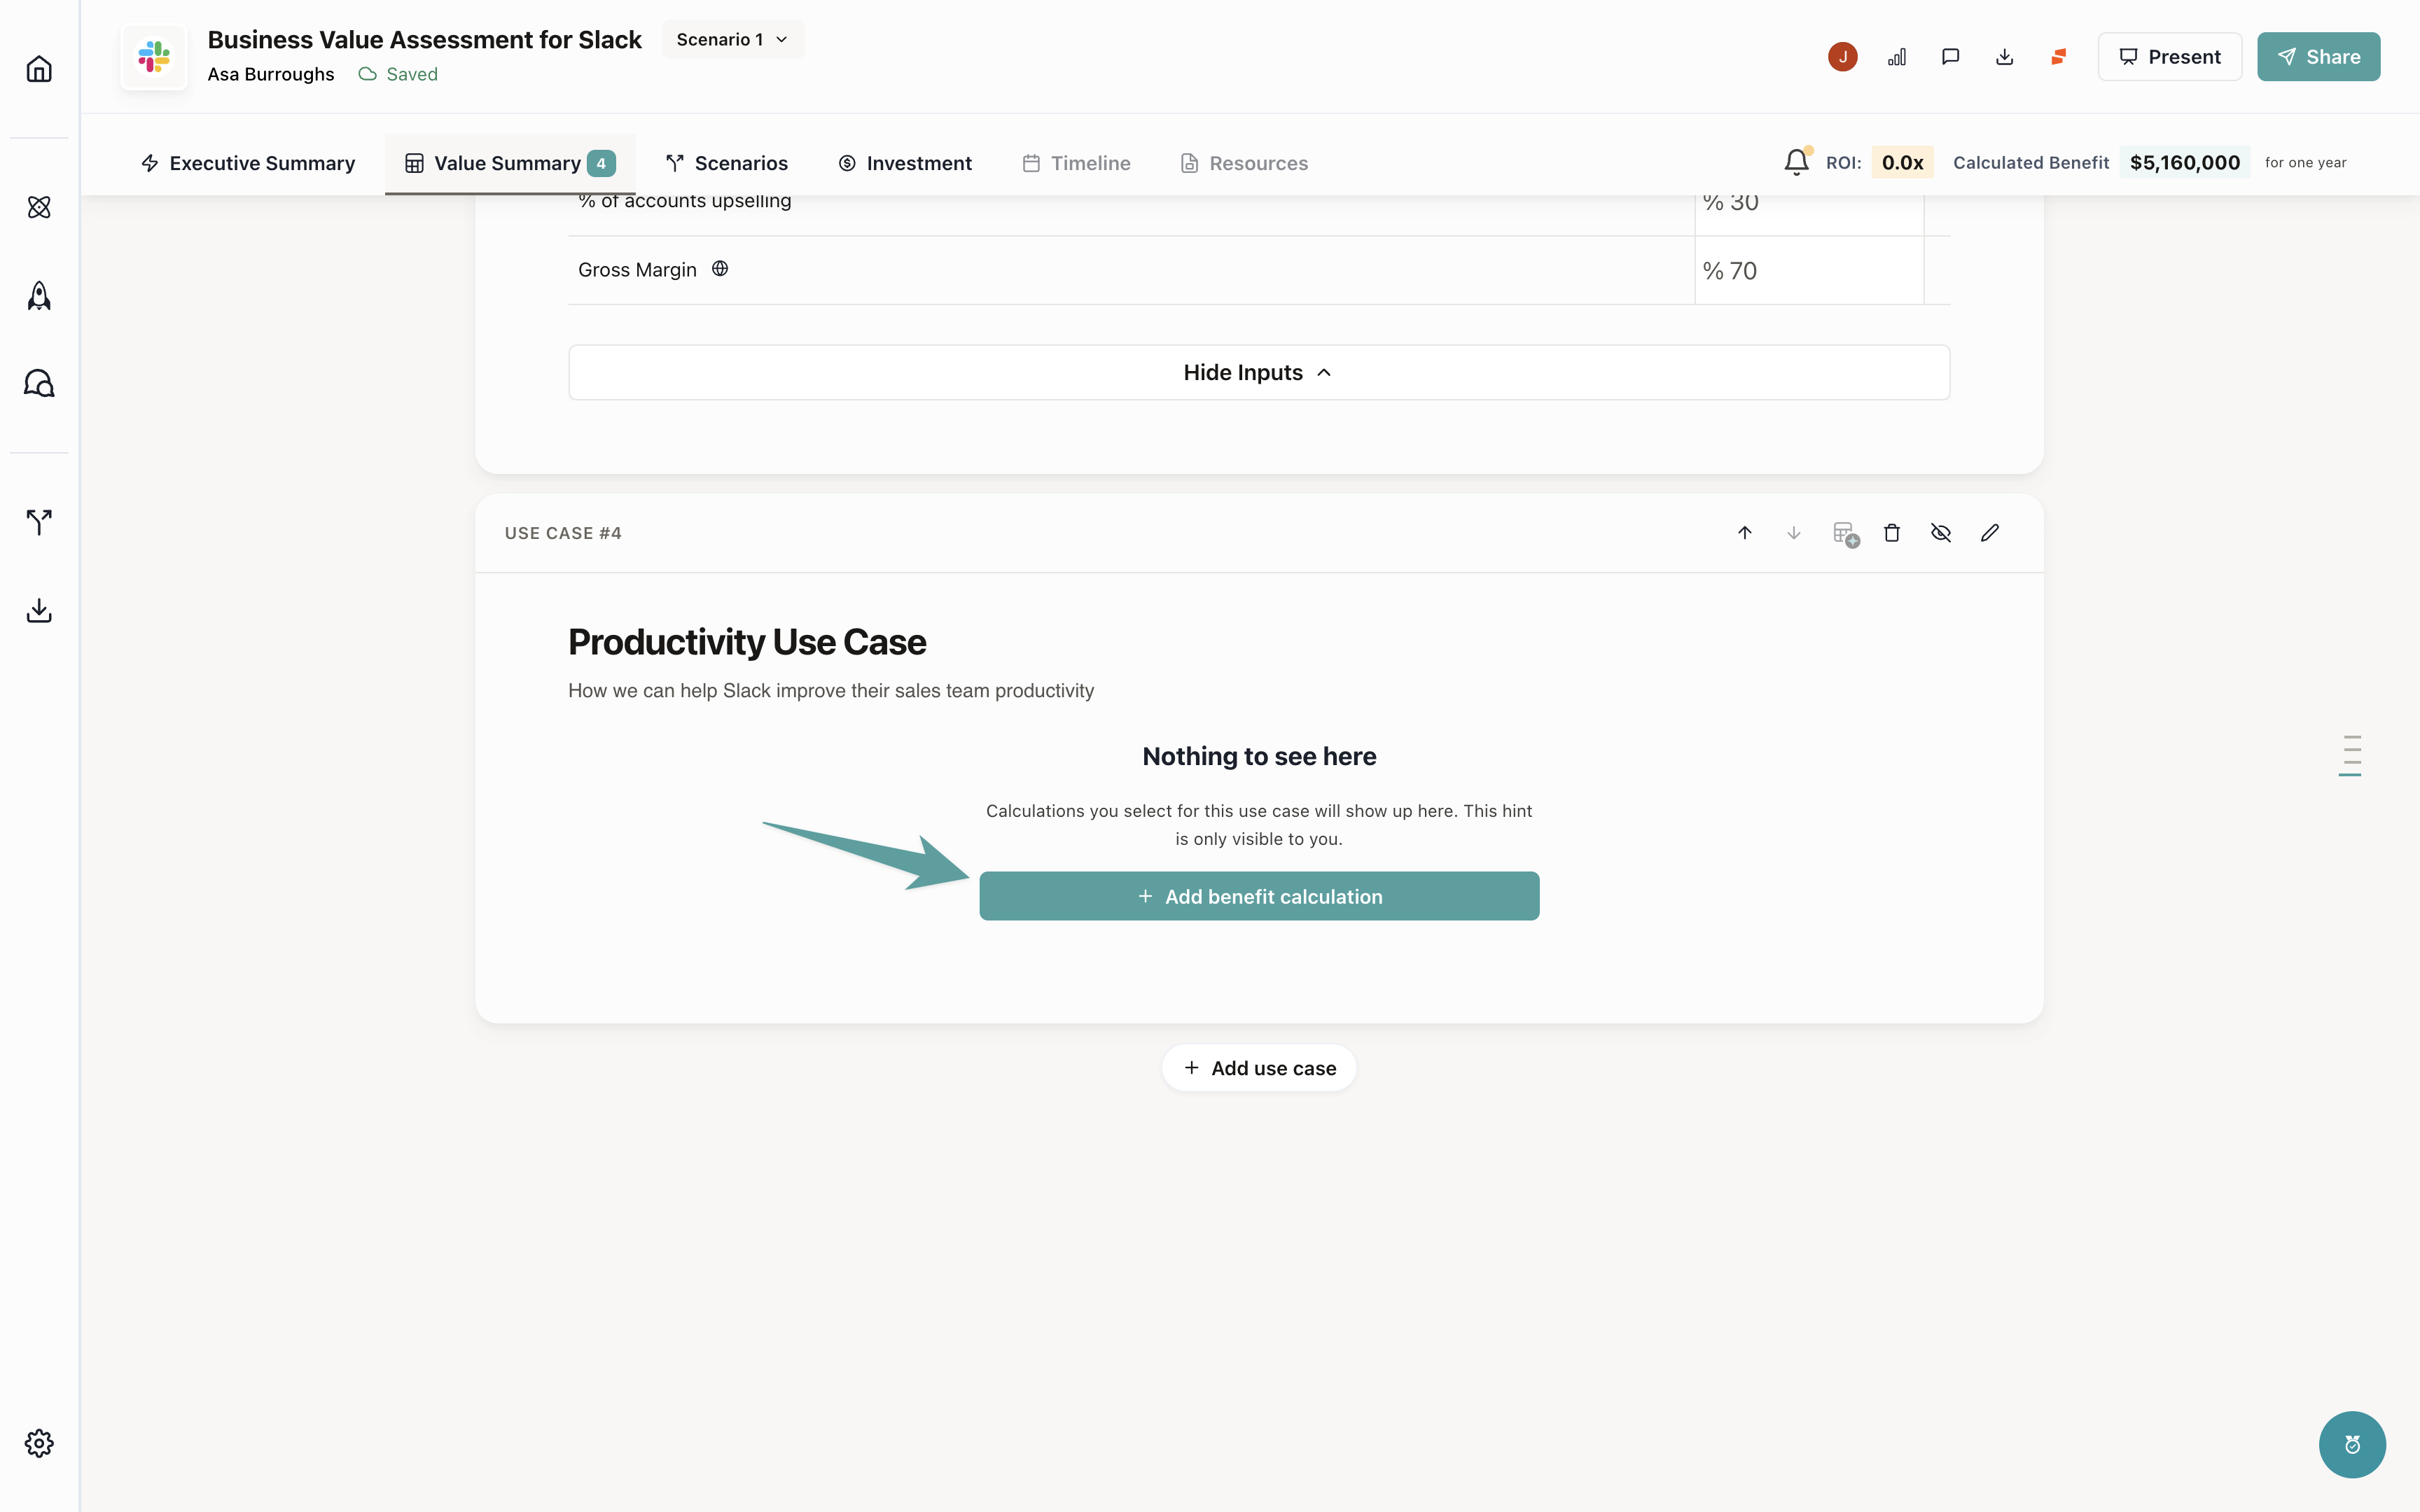
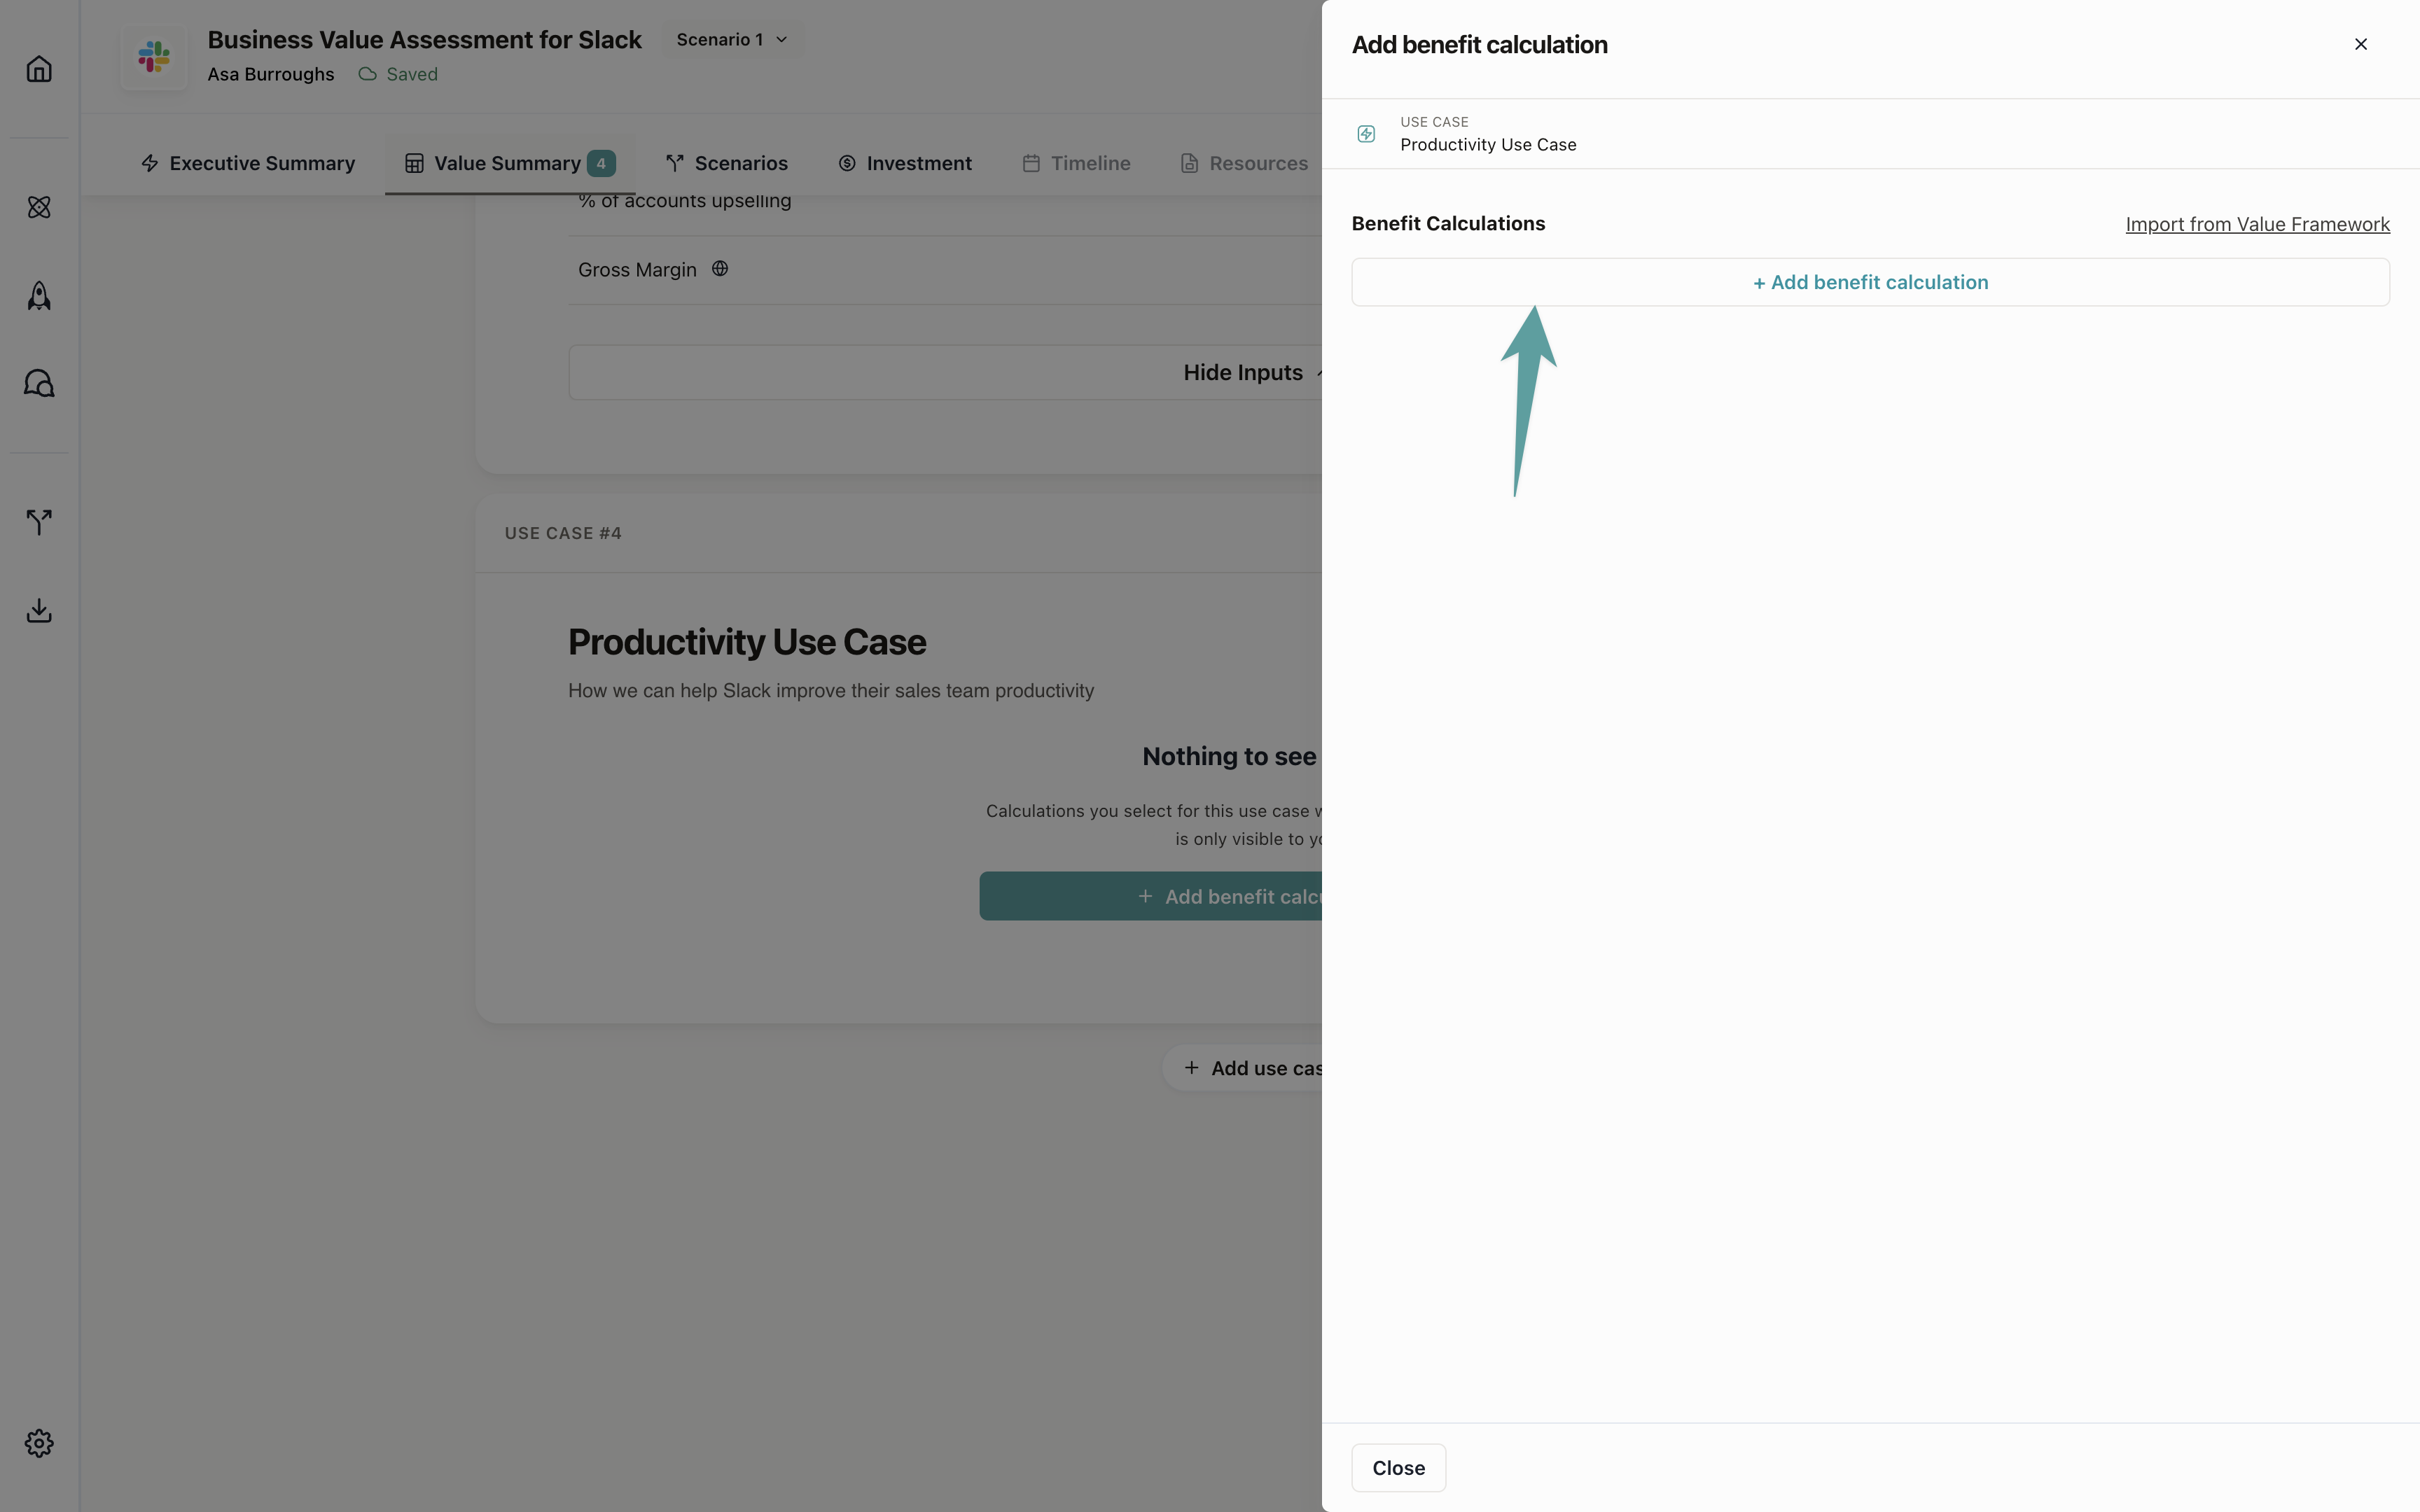
Add a calculation
Once you’ve created your use case, add a calculation to it.- Click Add Calculation in your use case
- You’ll see options to select a calculation type
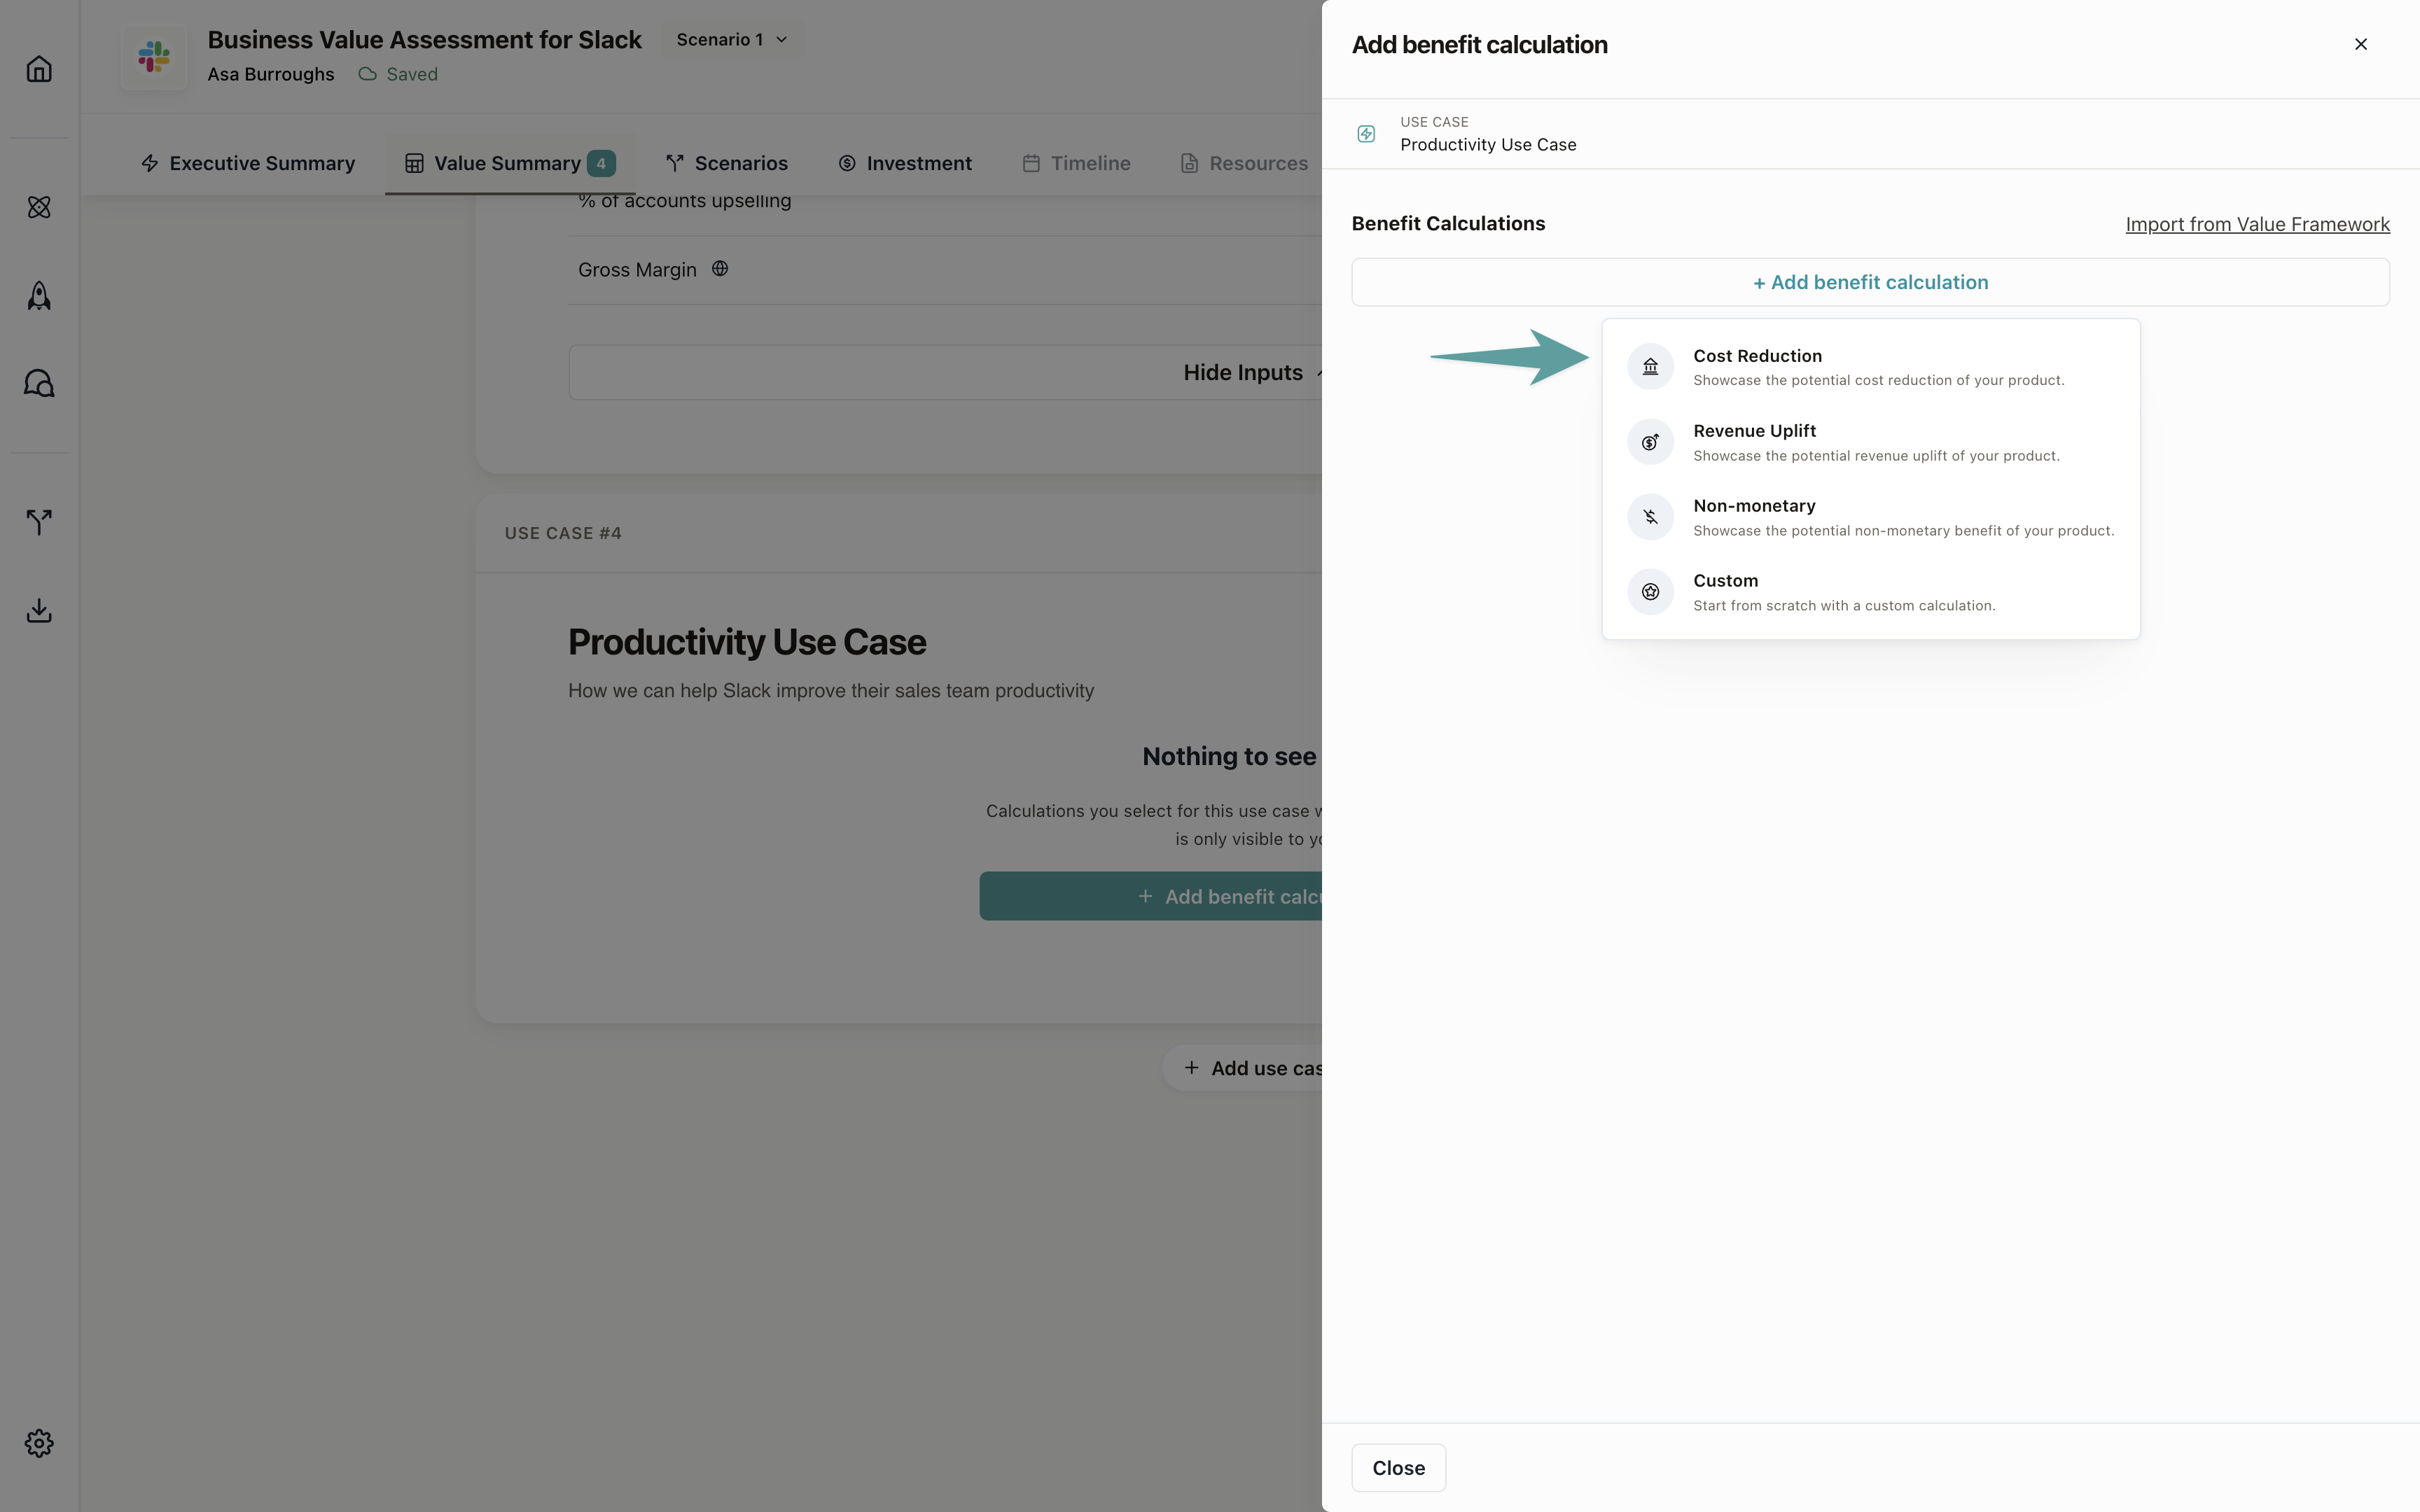
Select a calculation type
Calculation types determine how your calculation is formatted and displayed in business cases. Each type has a specific structure optimized for different value scenarios.| Calculation Type | Description | Best For |
|---|---|---|
| Cost Reduction | Compares current costs to future costs, showing savings | Headcount reduction, time savings, software consolidation |
| Revenue Uplift | Compares current revenue to future revenue, showing growth | Sales acceleration, conversion improvements, upsell opportunities |
| Custom | Flexible structure for any calculation format | Unique business models, non-standard value metrics |
| Non-Monetary | Quantifies value without currency (e.g., hours, units) | Time saved, quality improvements, risk mitigation |
Learn more about how calculation types affect use case card displays in
business cases.
Name and describe your calculation
Give your calculation a clear, outcome-focused name. The description should explain what value this calculation quantifies.- Enter a name (e.g., “Reduce Time on Task”)
- Add a description that explains the value story
Use outcome language, not feature language. “Reduce Time on Task” is better than “Task Automation Feature.”
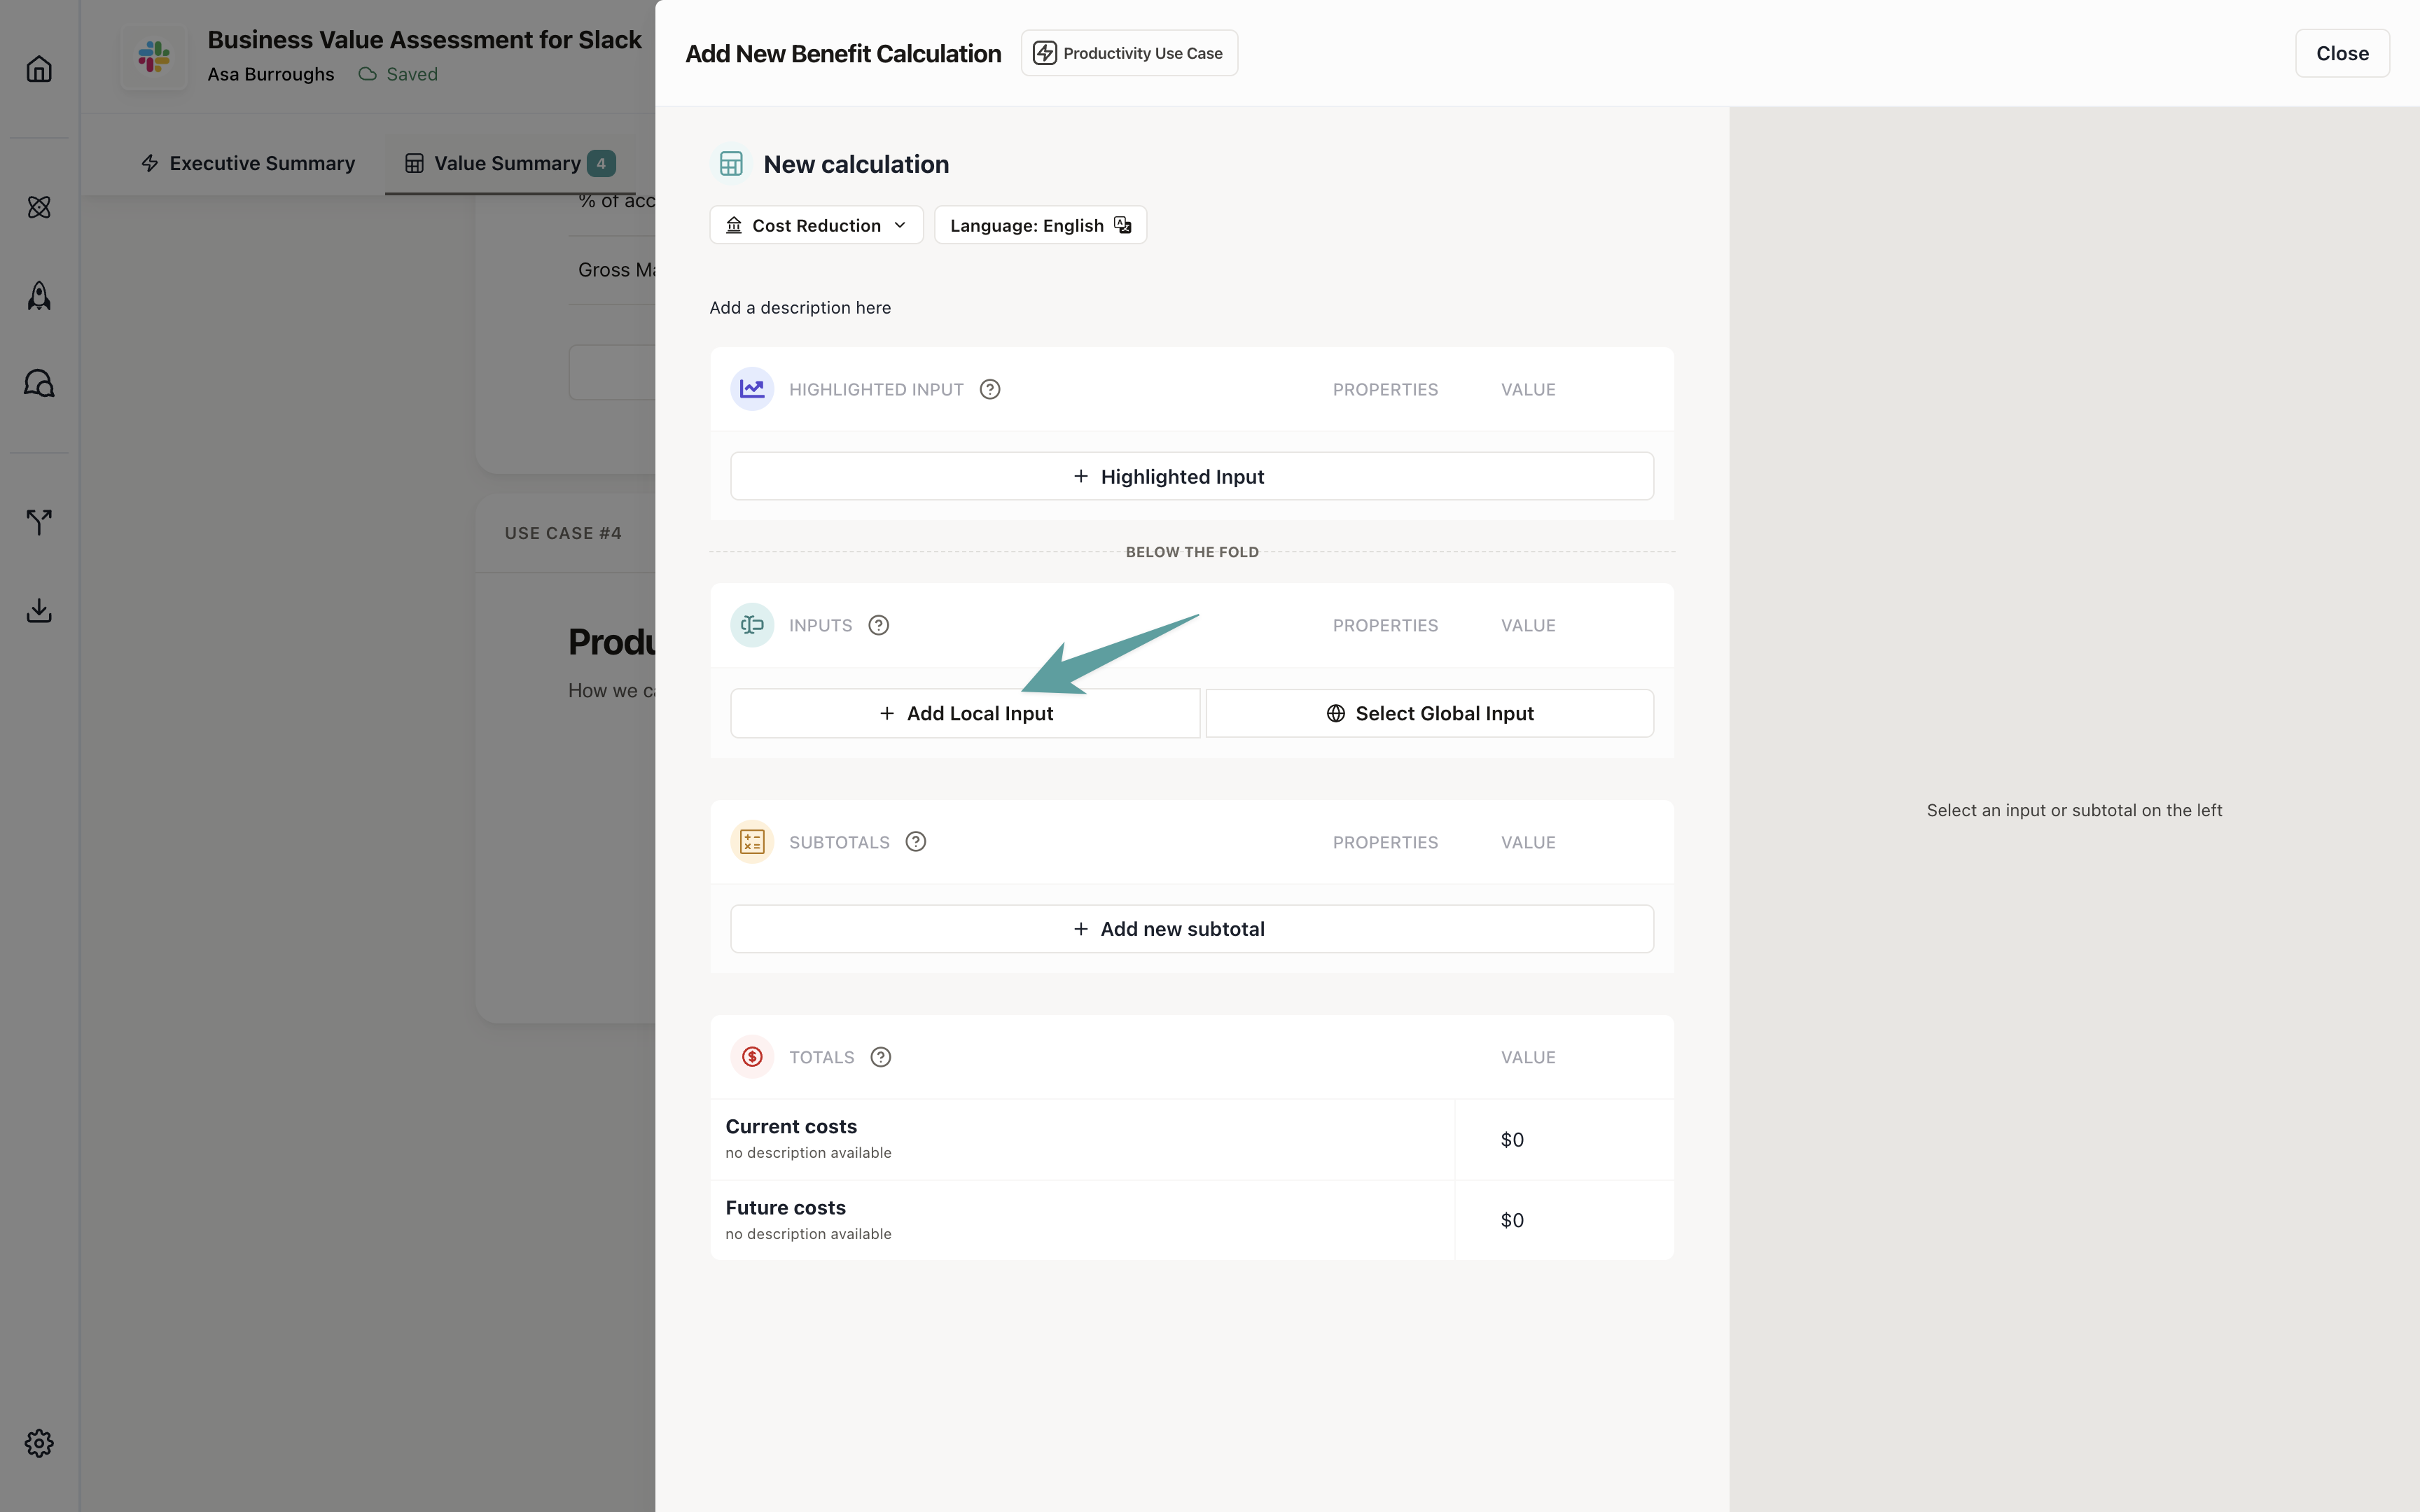
Add your first input
Inputs are the building blocks of your calculation. They represent the data points you need to quantify value.- Click Add Input
- You’ll configure the input details in the next step
Input types
Each input has a type that determines how it’s formatted and validated. Choose the type that best matches the data you’re capturing.| Input Type | Description | Example Values |
|---|---|---|
| Number | Whole numbers or decimals | 50, 2.5, 1000 |
| Currency | Monetary values | $50,000, €1,200 |
| Percentage | Percentage values (0-100) | 25%, 50%, 75% |
| Duration | Time periods (hours, minutes, days) | 2 hours, 30 minutes, 5 days |
| Text | Free-form text values | ”High”, “Low”, “Enterprise” |
Input types ensure consistent formatting across business cases. Currency inputs automatically format based on the
business case’s currency setting.
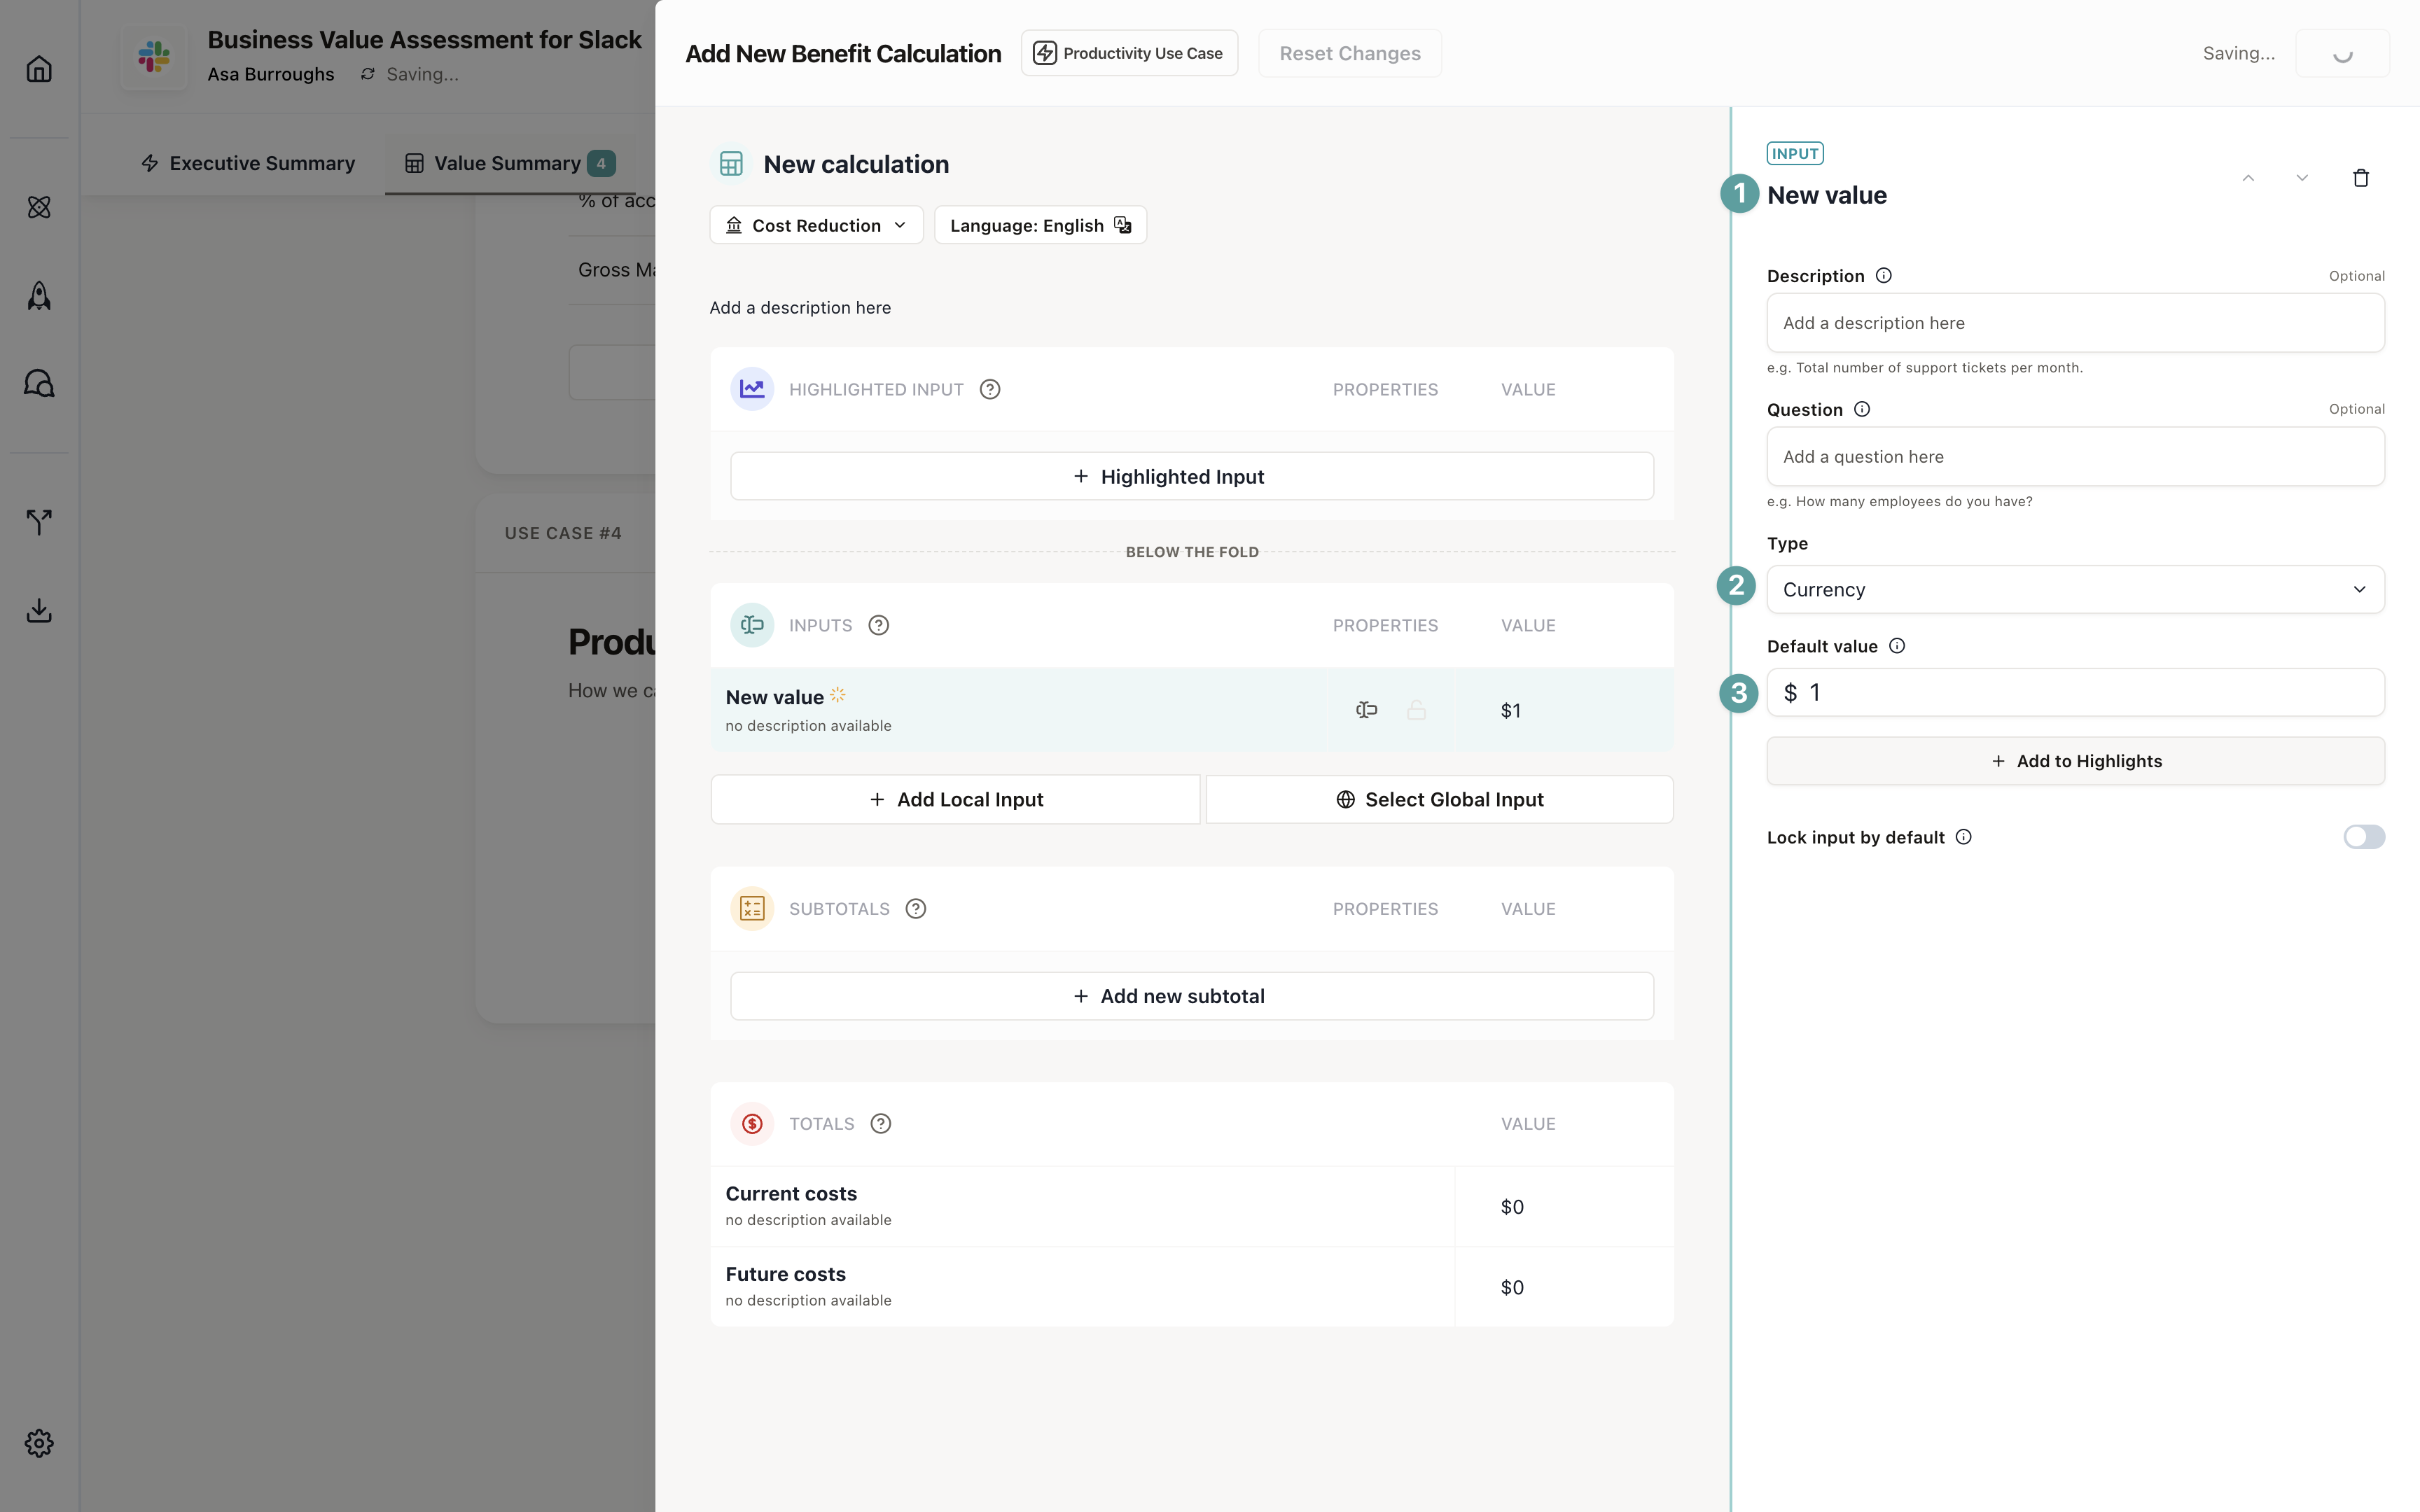
Configure your inputs
For this Cost Reduction calculation, we need to measure how long a task takes, how often it’s completed, how many employees do it, and what they cost per hour.Input 1: Time per task
This measures how long it takes to complete the task once.- Name: “Time per Task”
- Type: Duration
- Unit: Hours
- Default value: 2 (hours)
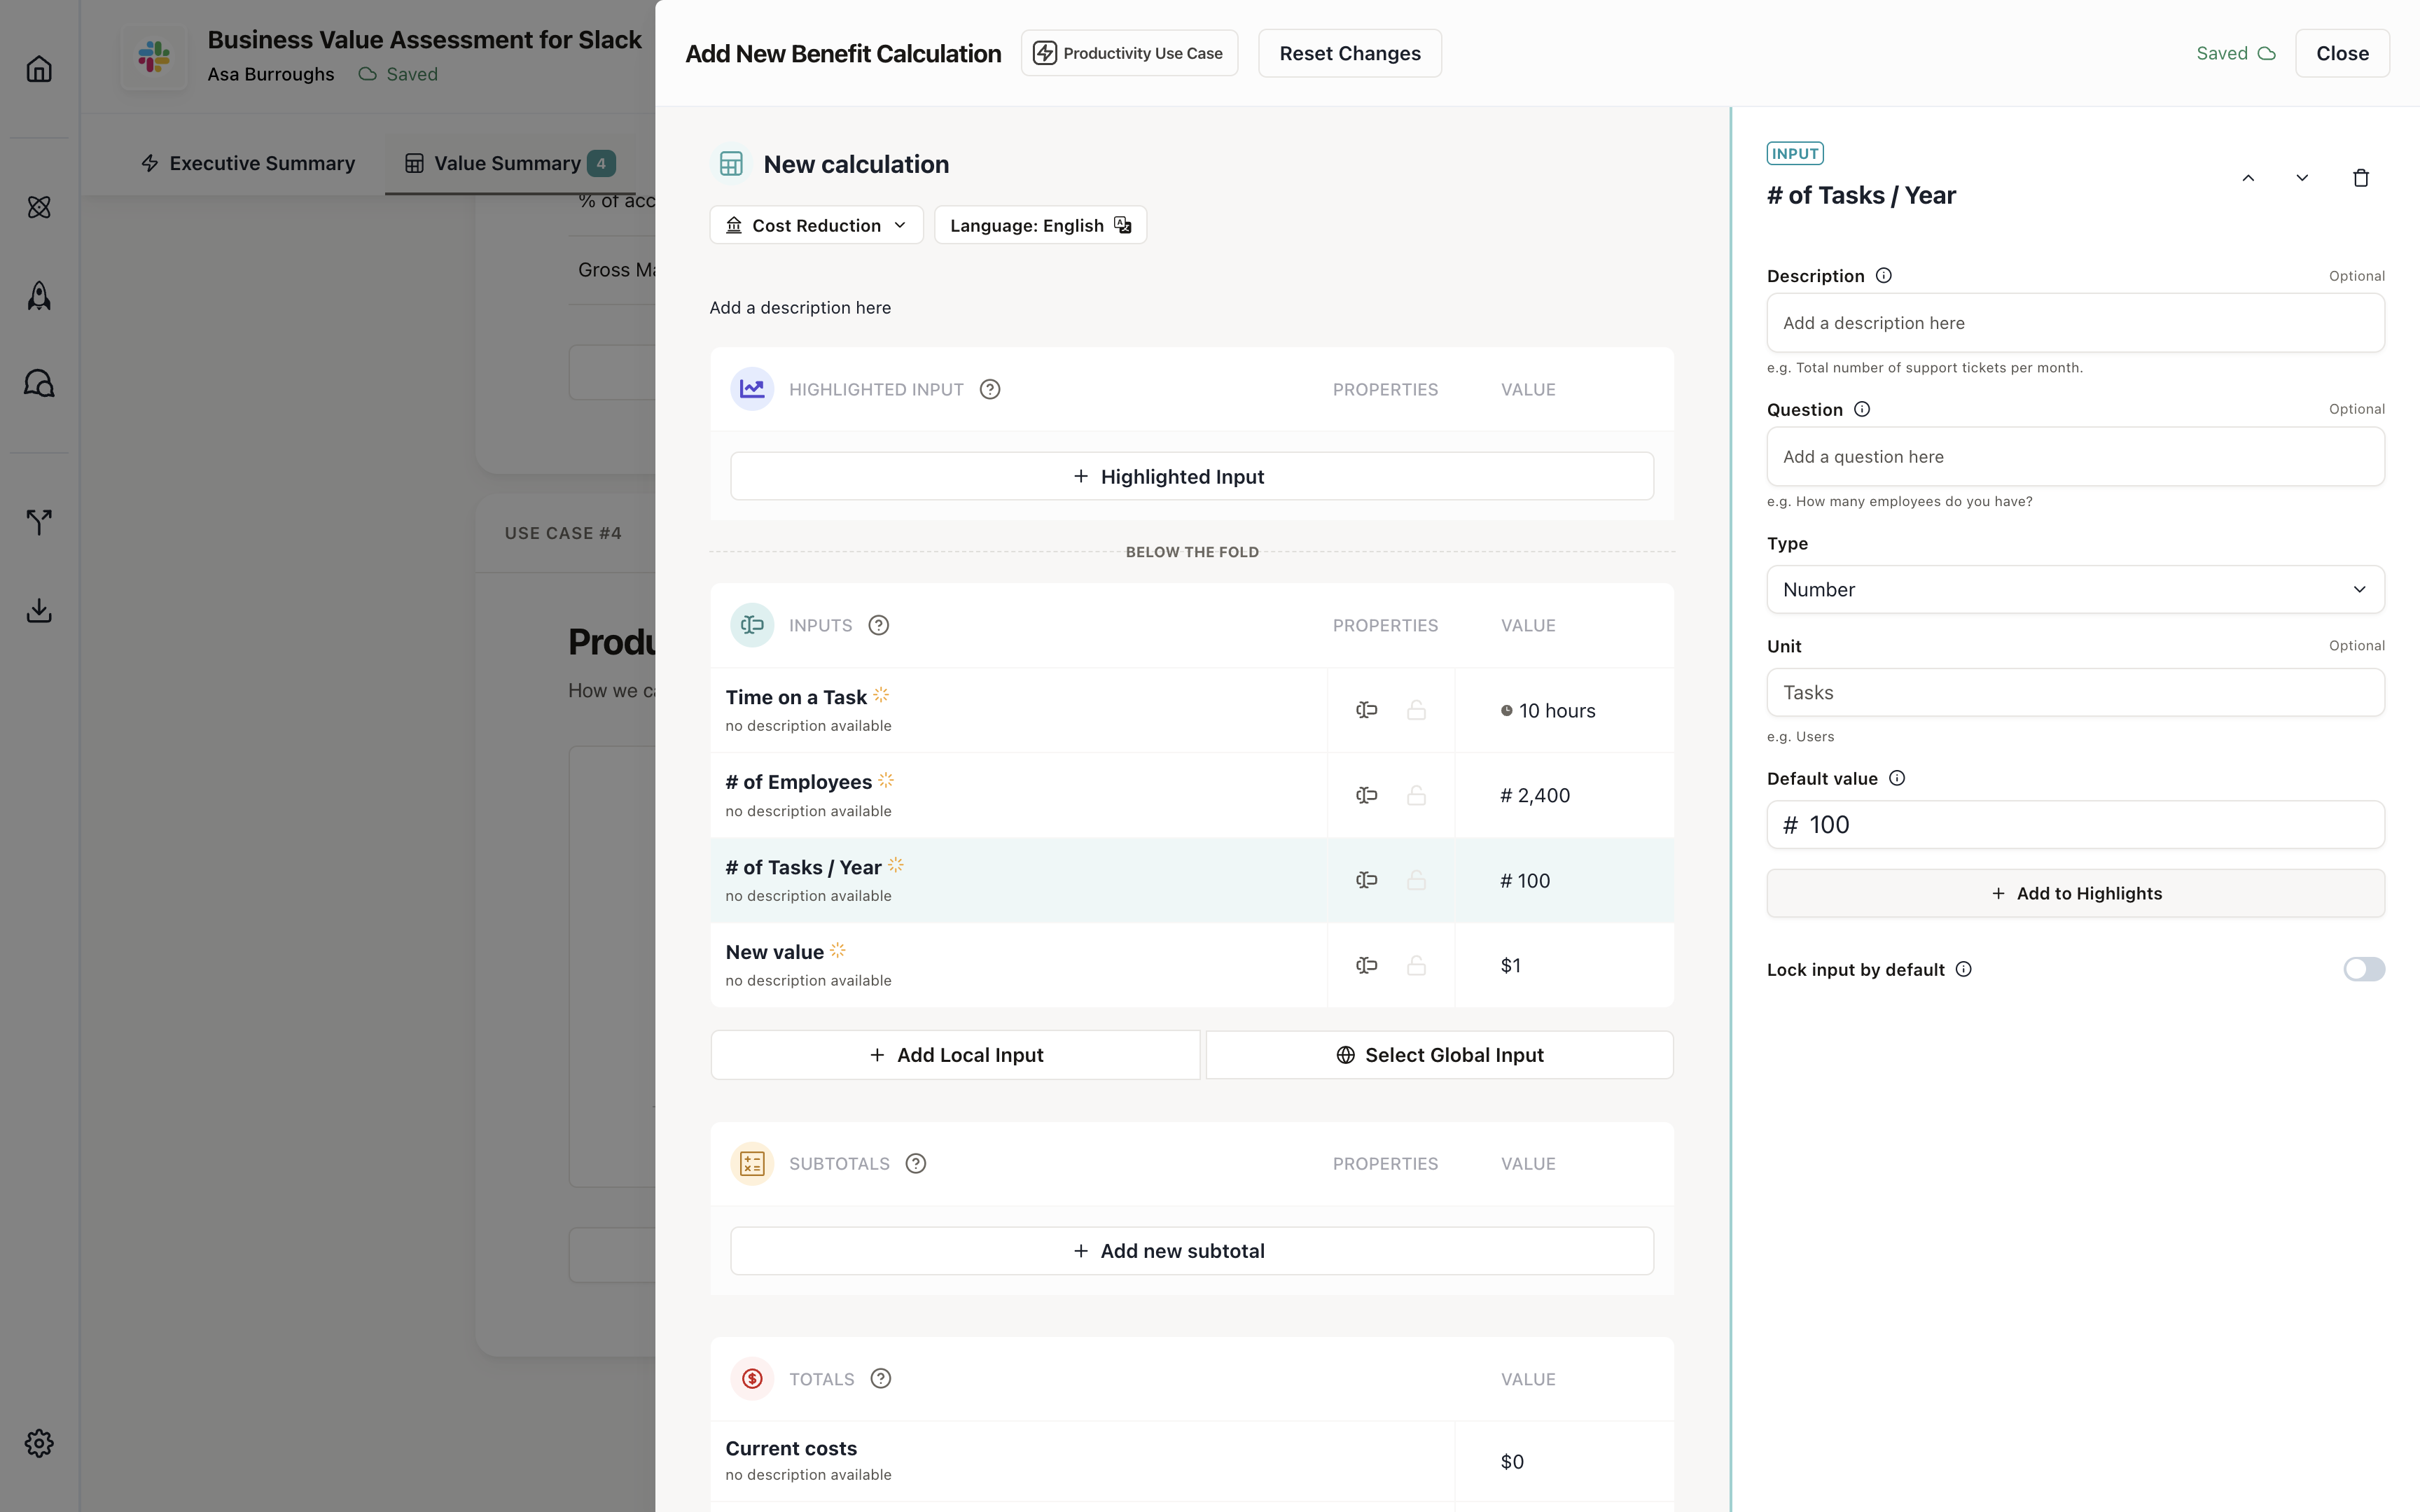
Input 2: Tasks per year
This measures how many times the task is completed annually.- Name: ”# of Tasks per Year”
- Type: Number
- Default value: 100
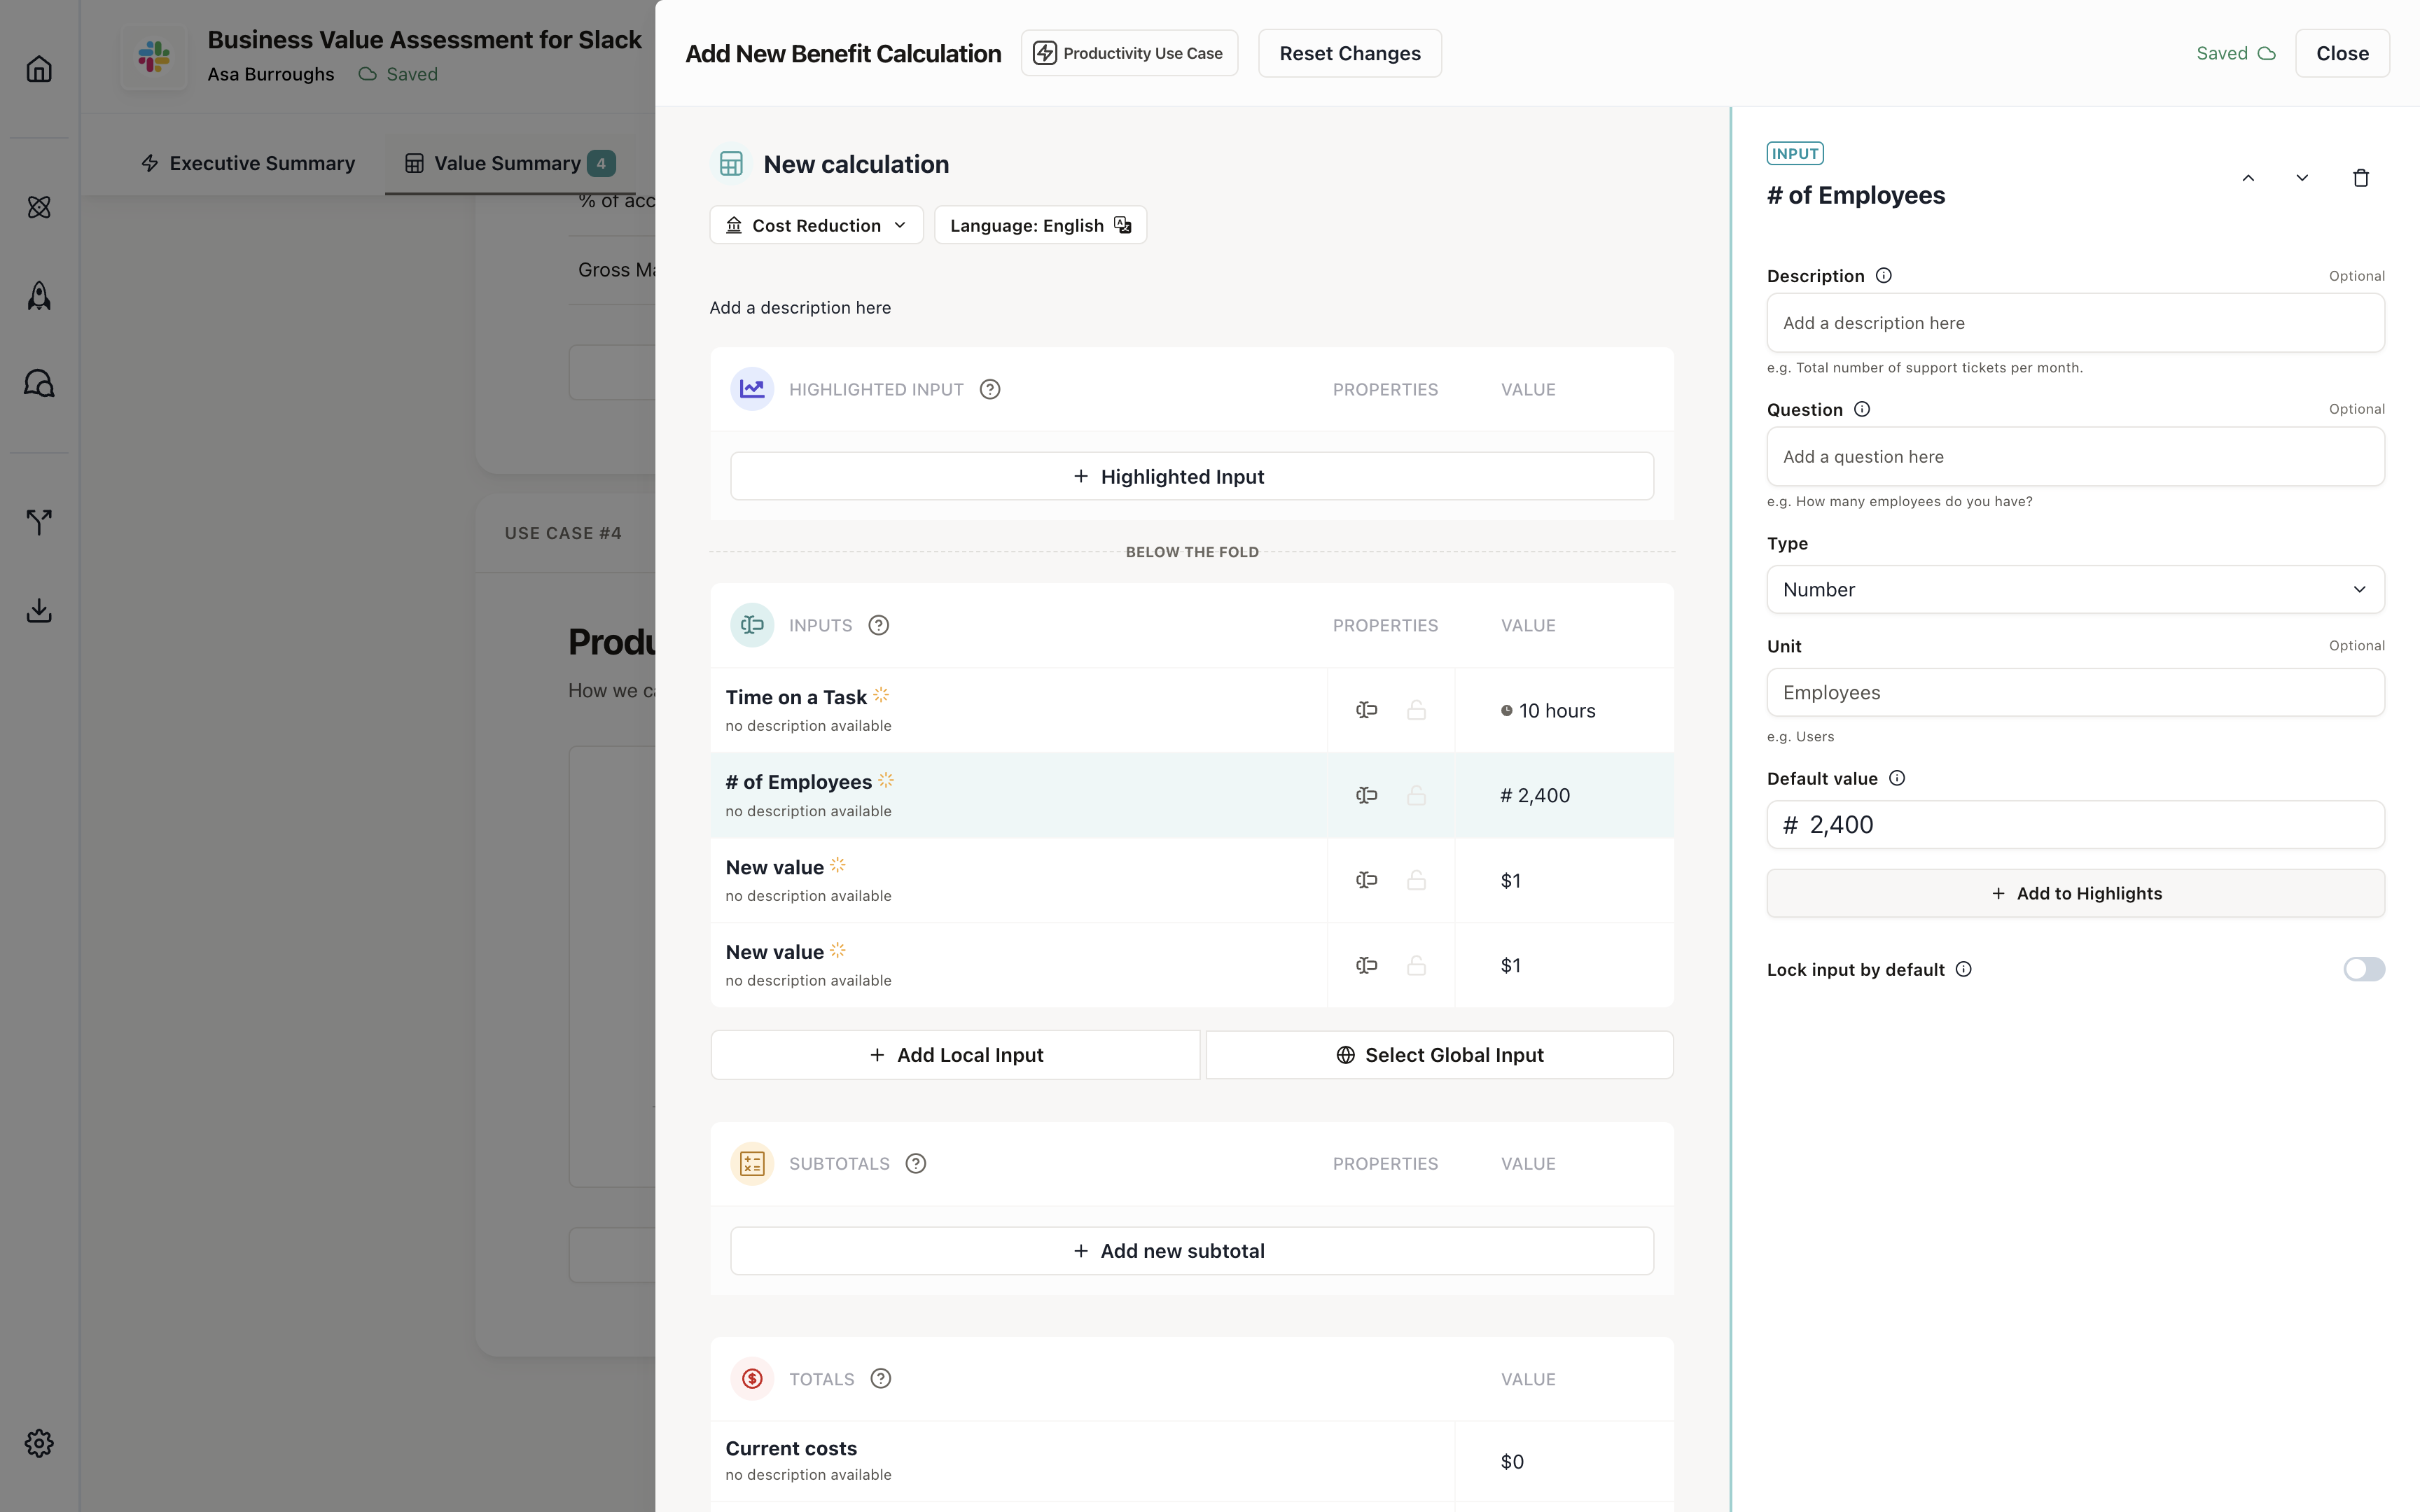
Input 3: Number of employees
This measures how many employees complete this task.- Name: ”# of Employees”
- Type: Number
- Default value: 10
Input 4: Average hourly rate
This measures the average hourly cost of employees who complete the task.- Name: “Average Hourly Rate”
- Type: Currency
- Default value: $50
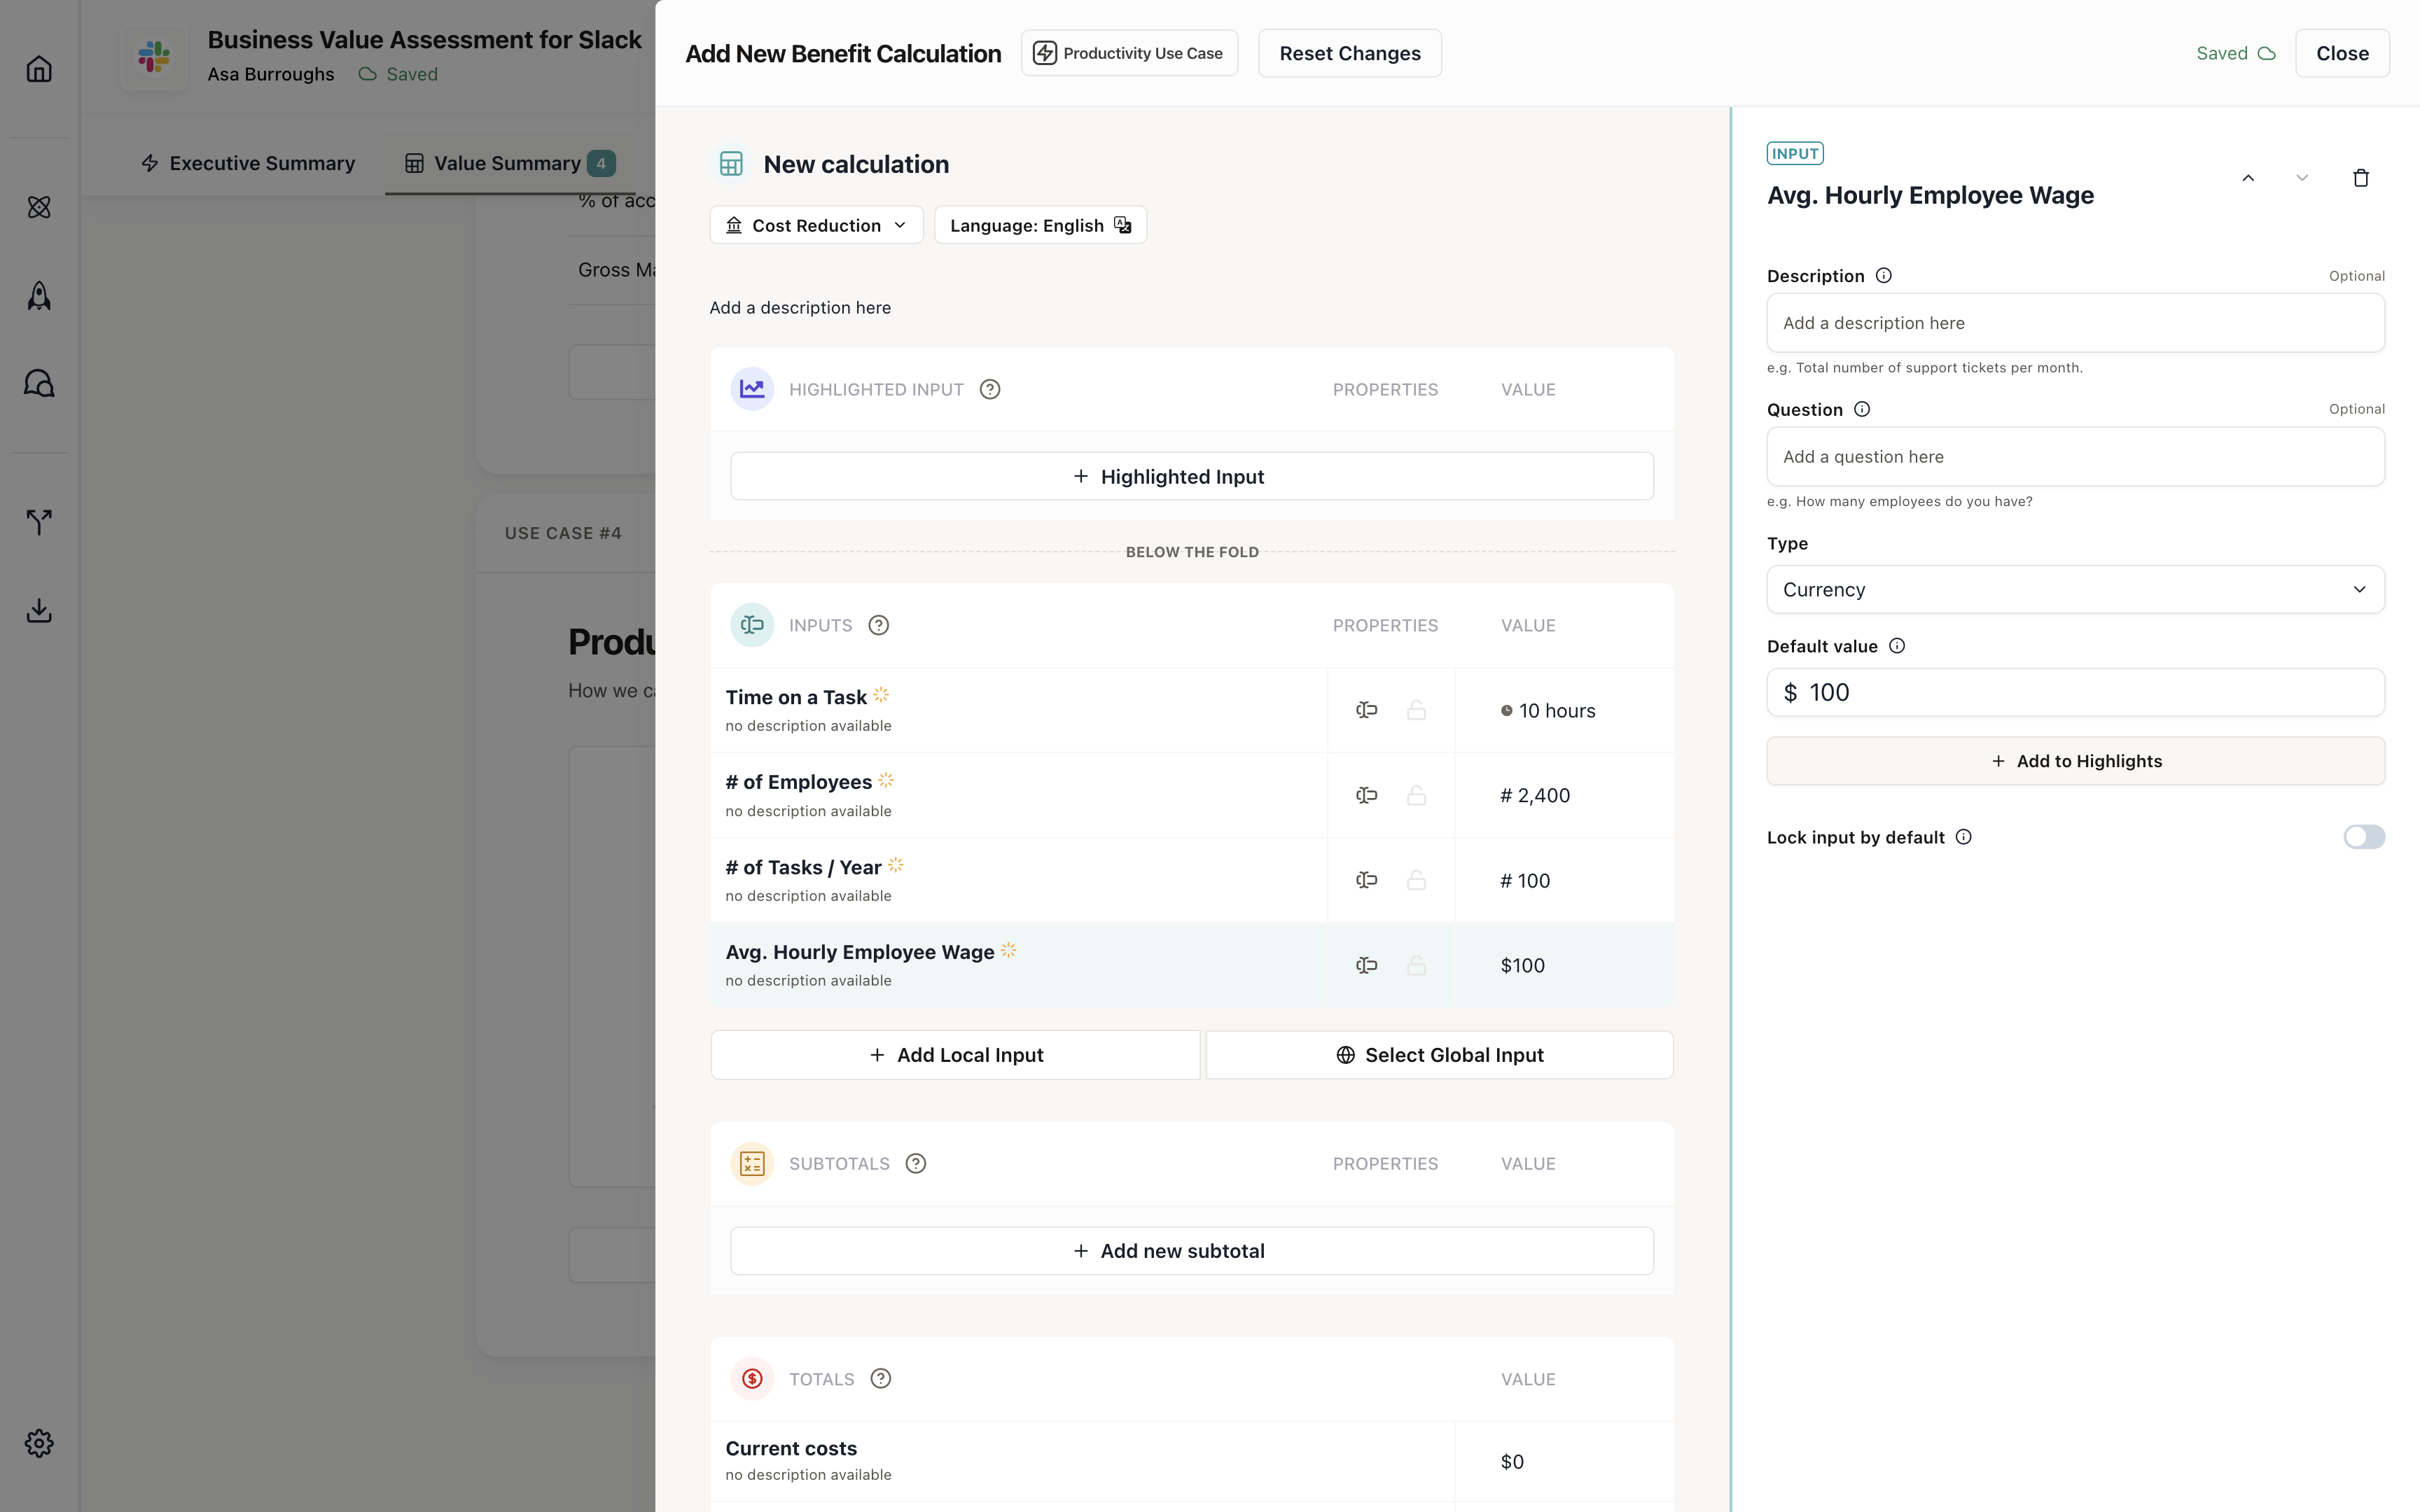
Your inputs are configured. You should see them in your calculation builder.
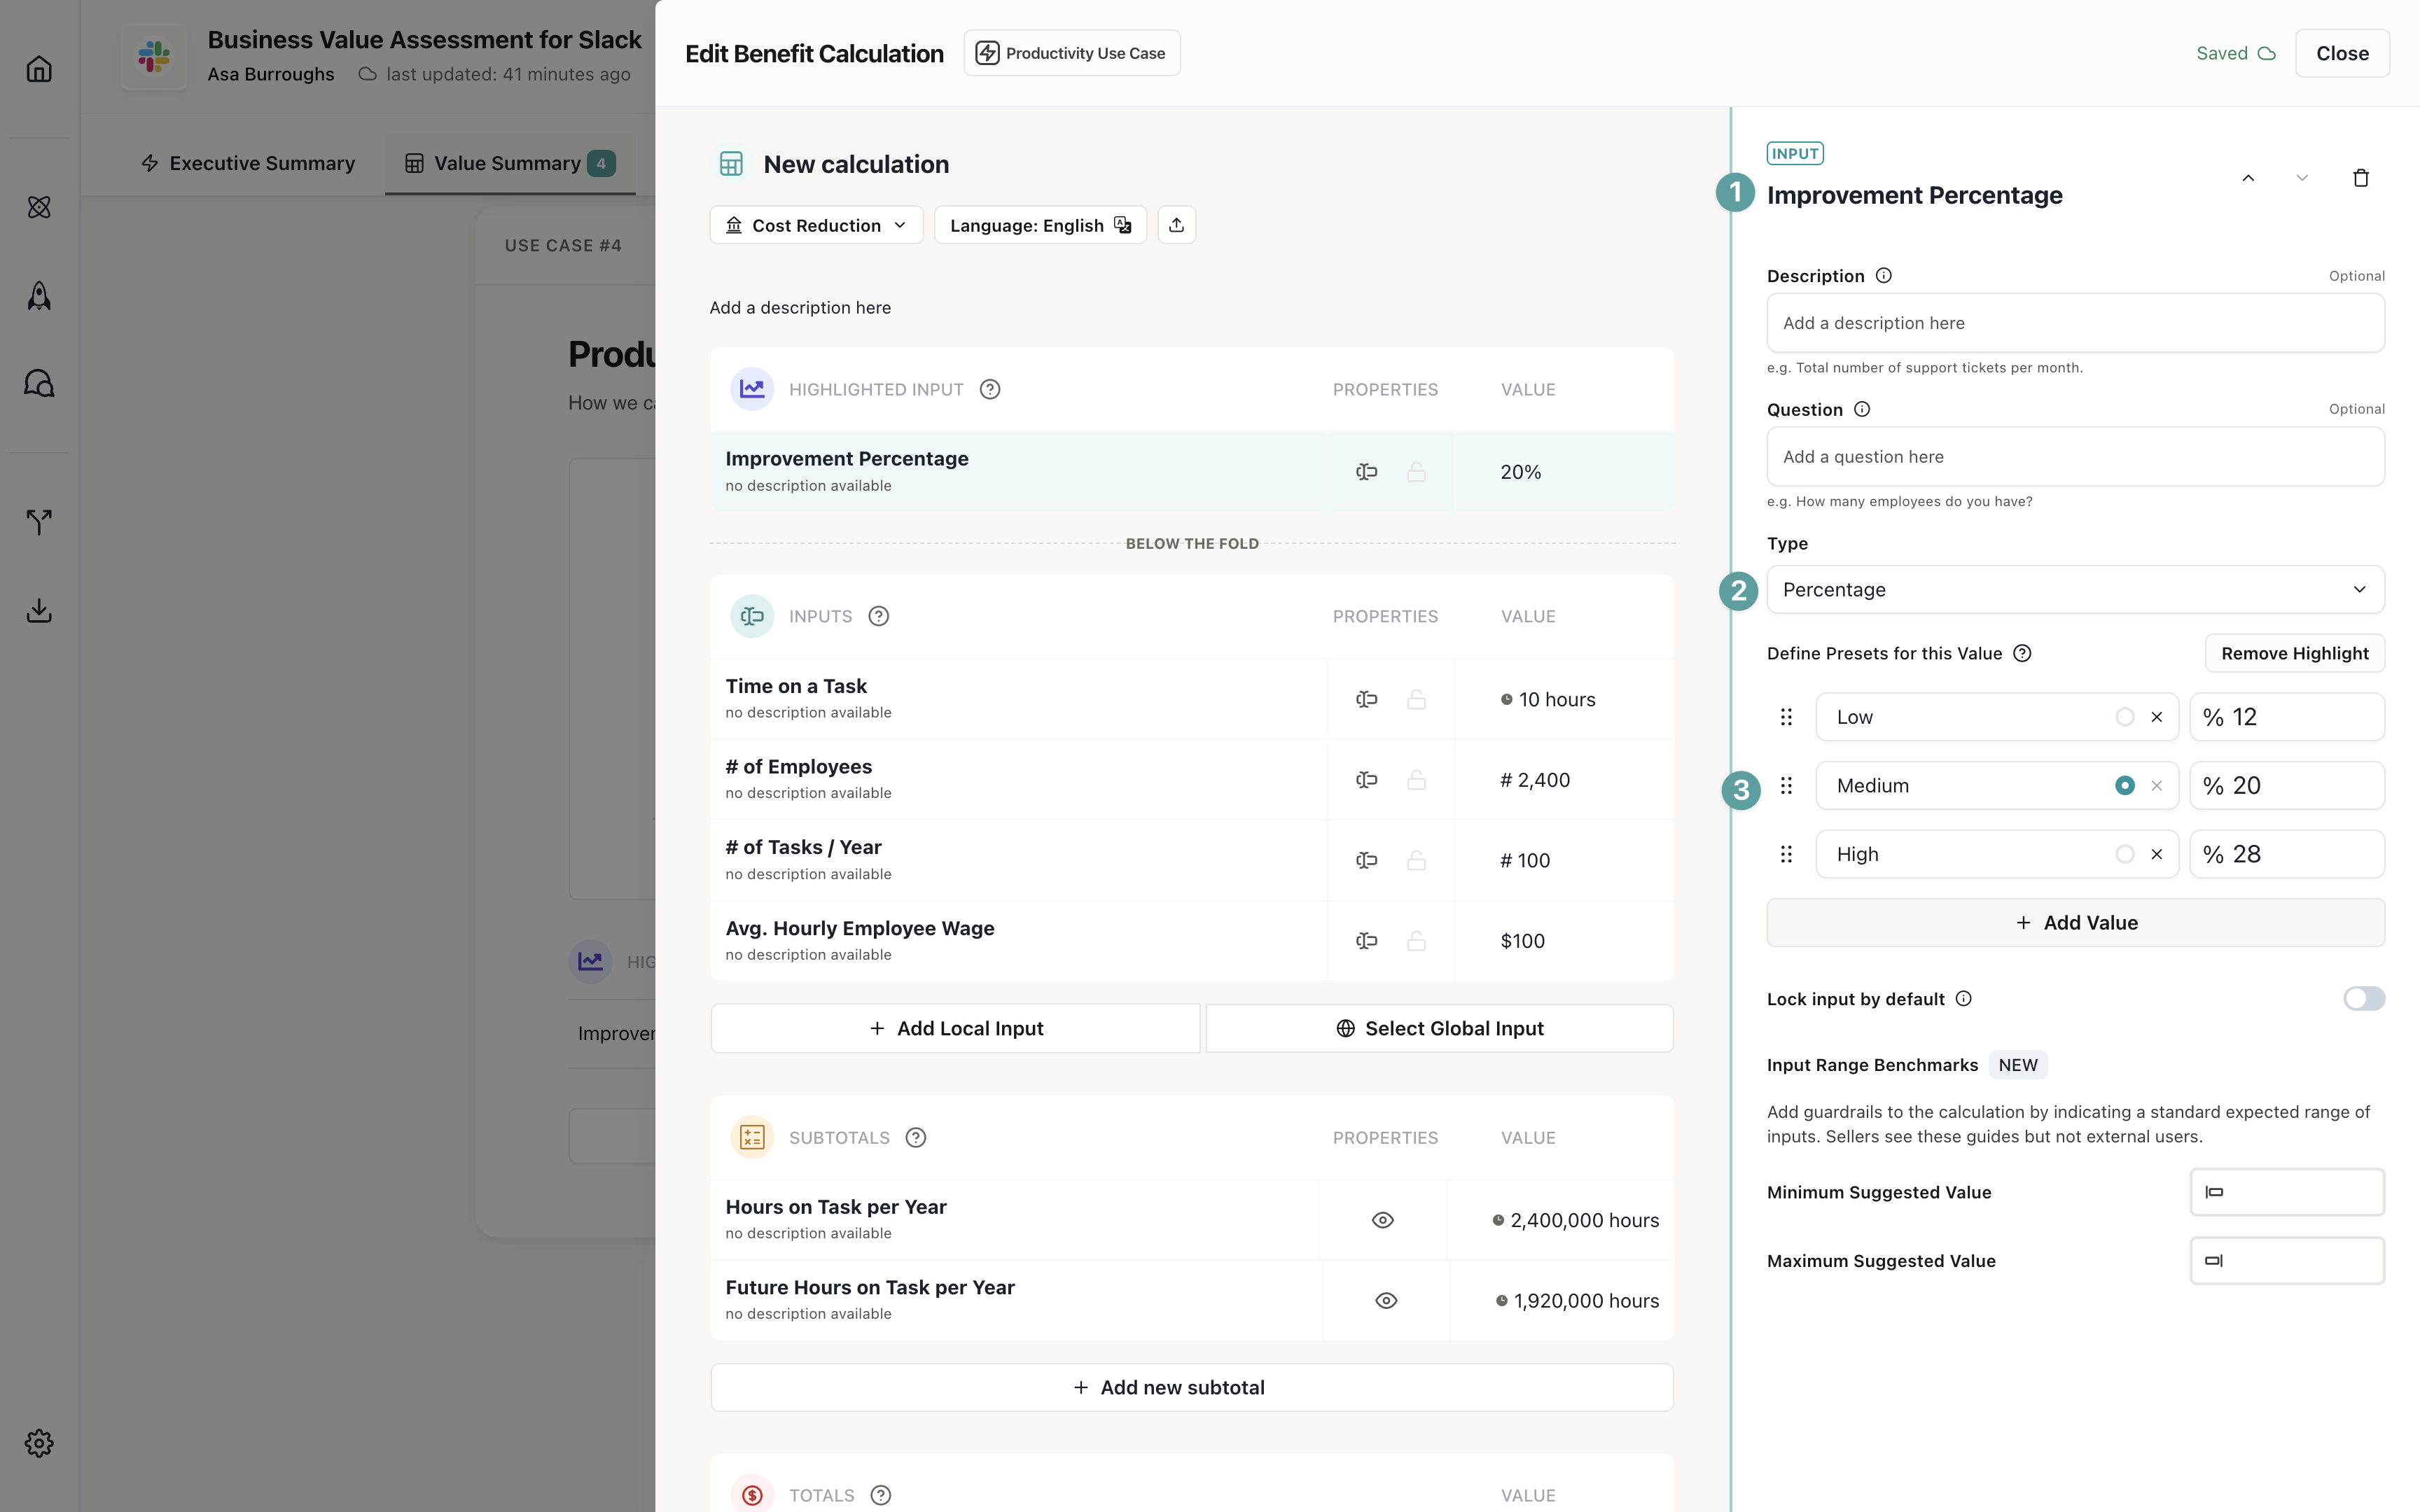
Add highlighted inputs
Highlighted inputs appear at the top of the input list on use case cards and are always visible. They’re perfect for improvement percentages, key future-value drivers, or customer profile variables. You can highlight multiple inputs per calculation. For this calculation, we’ll add an improvement percentage that shows how much more efficient your solution makes the task.- Click Add Input
- Name: “Improvement %”
- Type: Percentage
- Check Highlight this input to make it a highlighted input
- Set default value: 20%
Configure value presets
Value presets let users quickly select common values instead of typing. This is especially useful for improvement percentages where you might have standard scenarios.- Click Add Preset
- Add presets like:
- Low: 12%
- Medium: 20%
- High: 28%
You can highlight multiple inputs per calculation. Any highlighted input can have its own value presets. This is
useful when a calculation has several key variables that buyers should focus on. Learn more about
highlighted inputs.
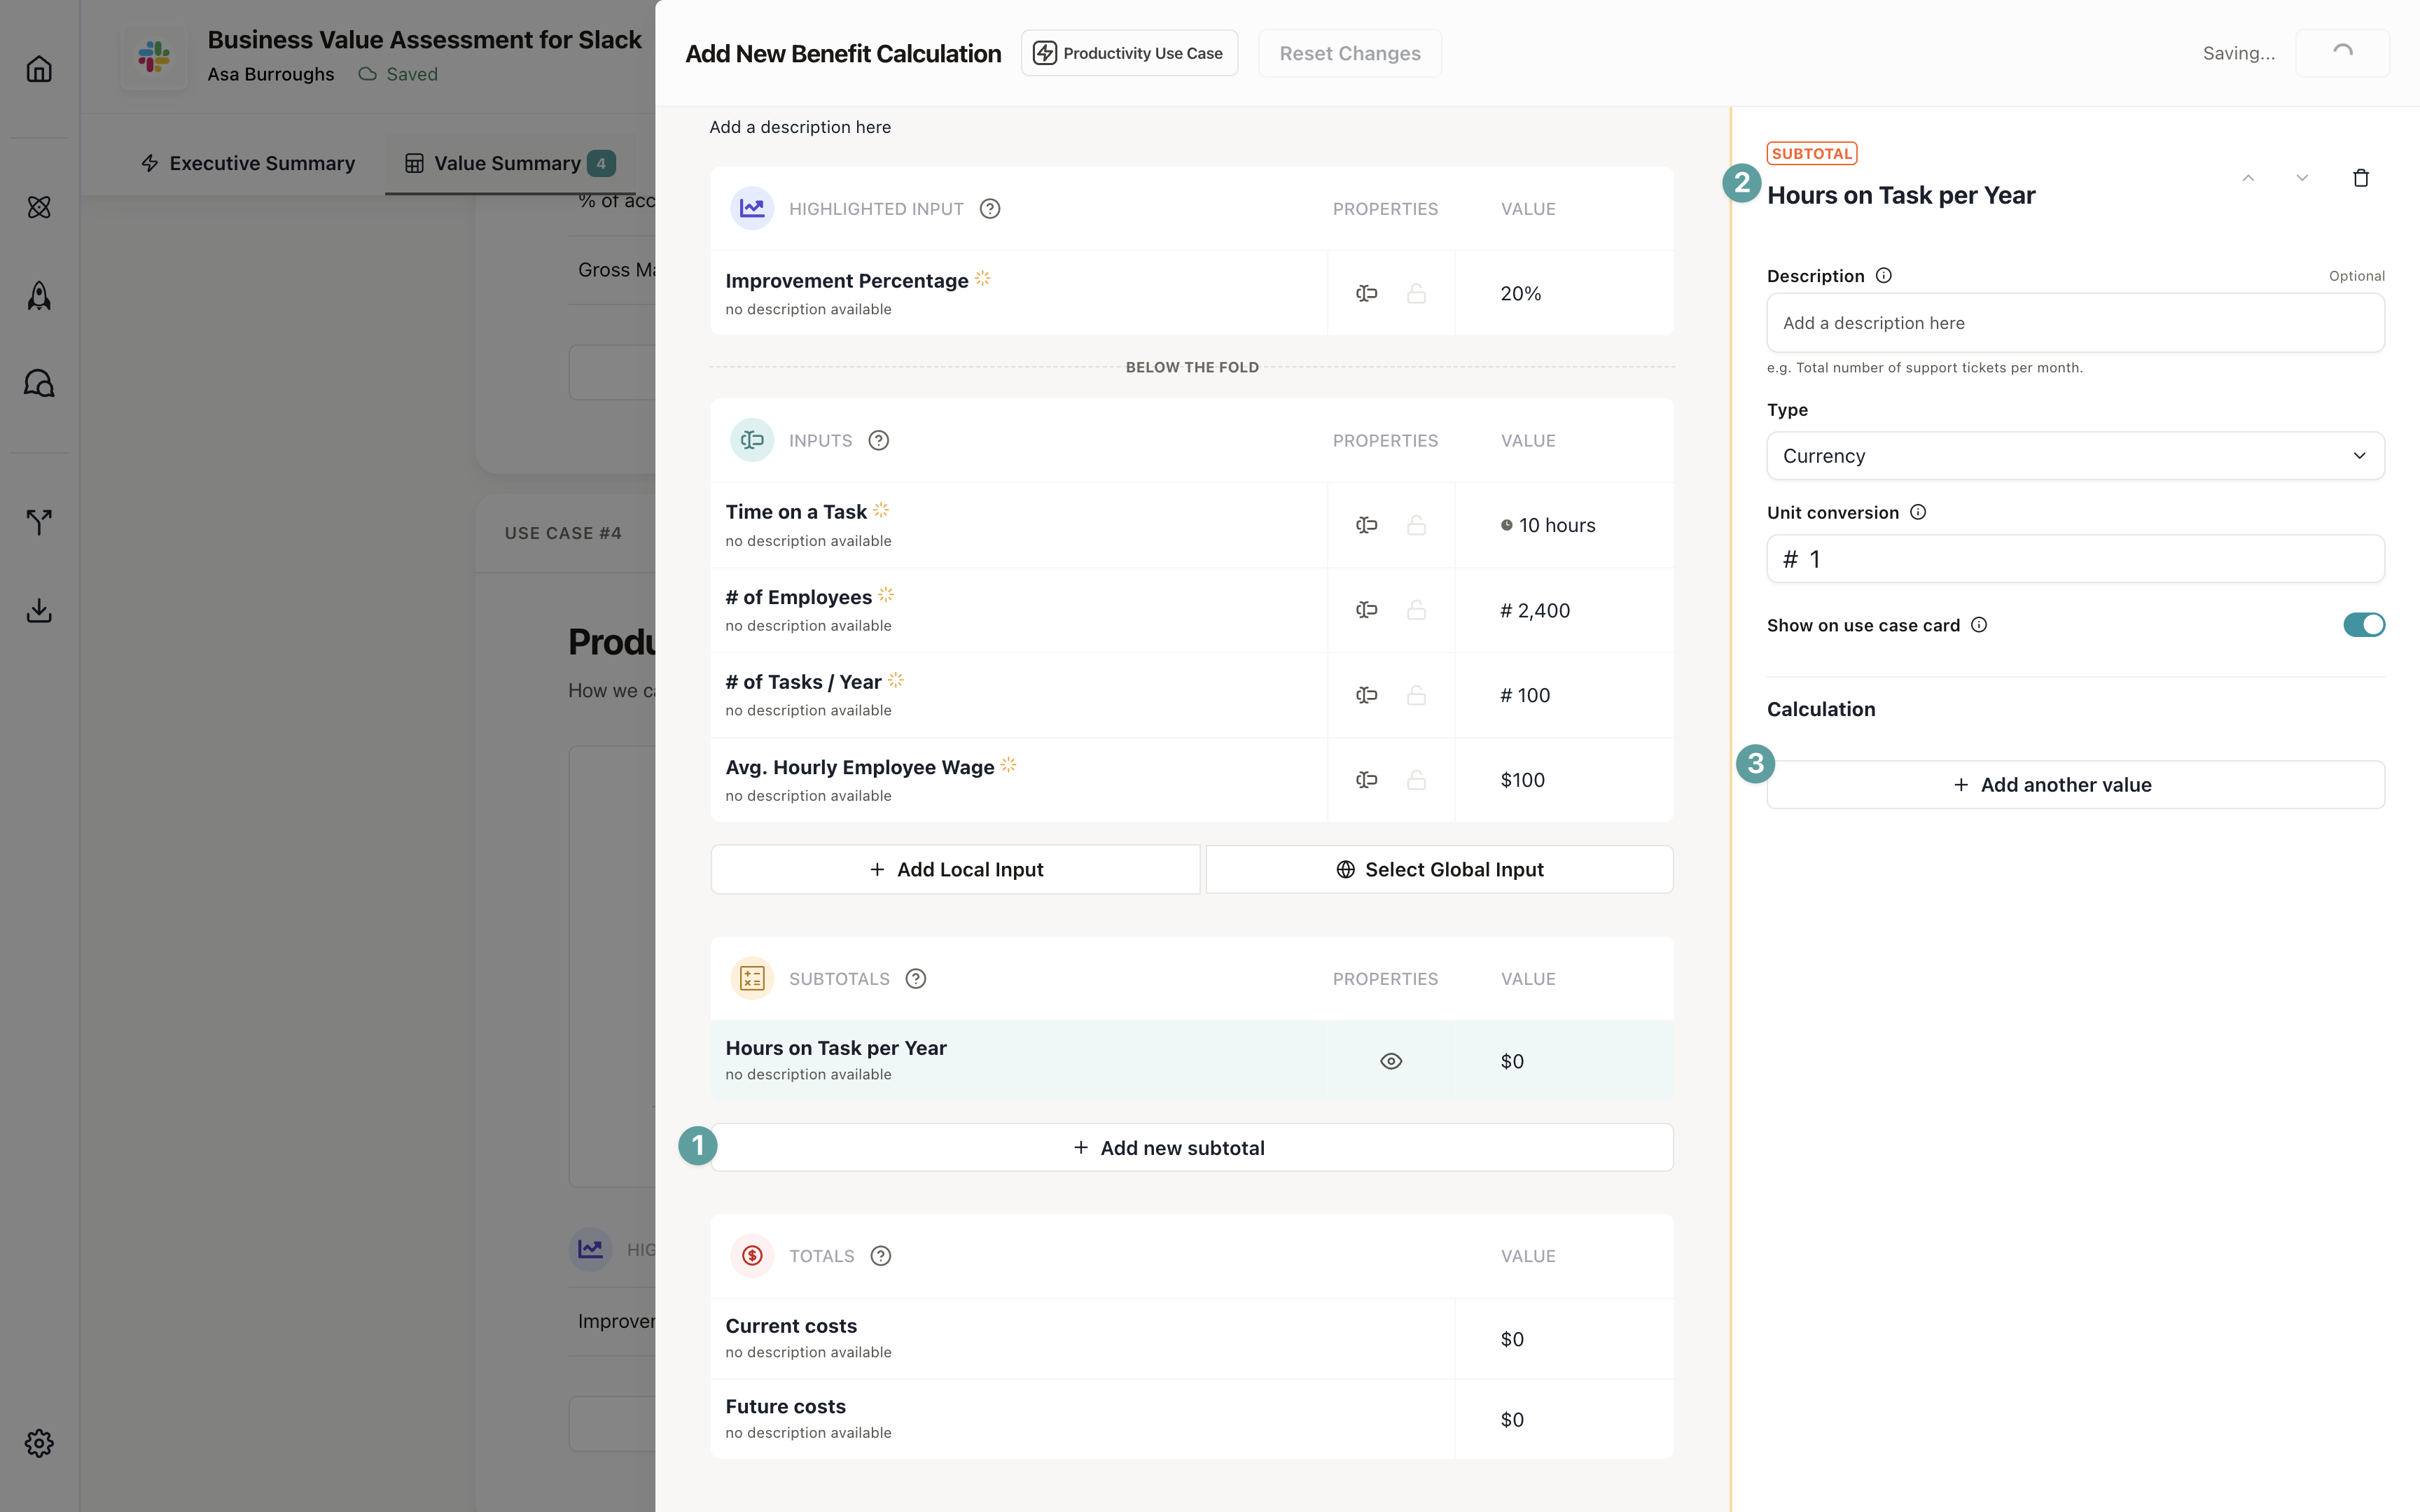
Build your first subtotal
Subtotals combine multiple inputs to calculate intermediate values. For this calculation, we’ll create two subtotals:- Annual hours (current): Total hours spent on the task per year
- Annual hours (future): Total hours after improvement
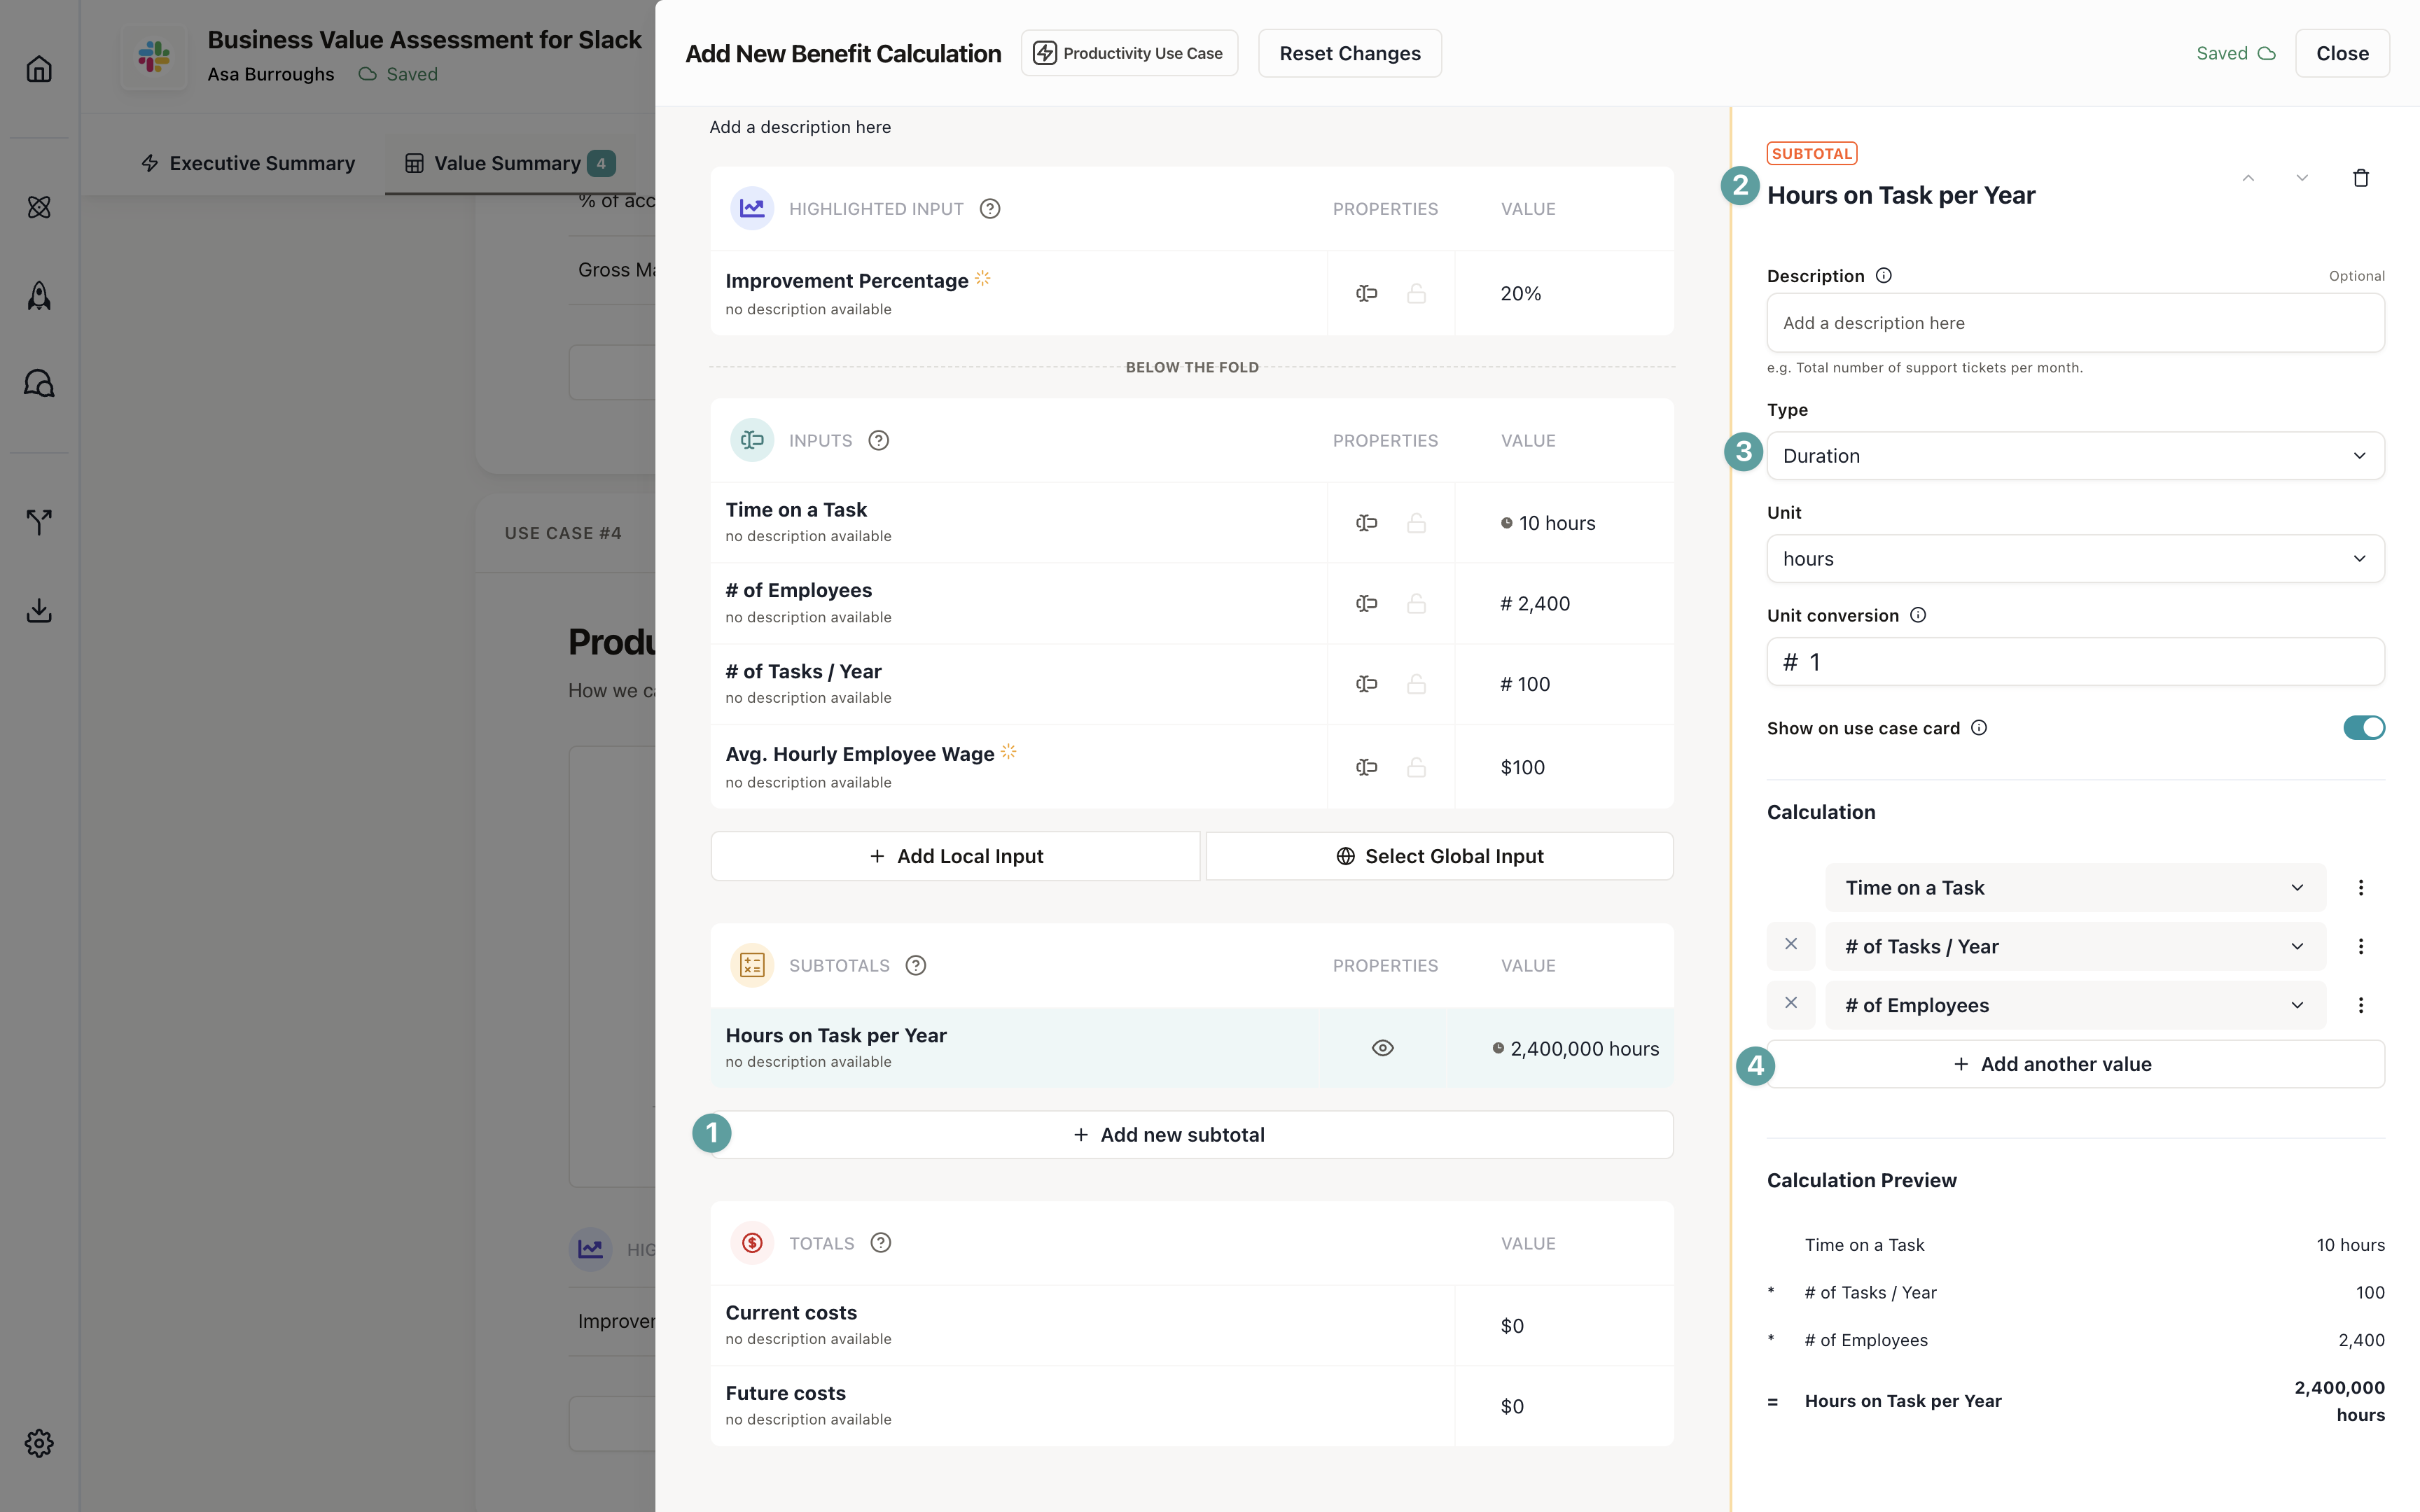
First subtotal: Annual hours (current)
This multiplies all inputs except the improvement percentage to get the total annual hours.- Click Add Subtotal
- Name: “Annual Hours (Current)”
- Build the formula:
- Multiply: Time per Task × # of Tasks per Year × # of Employees
- Formula:
Time per Task × # of Tasks per Year × # of Employees
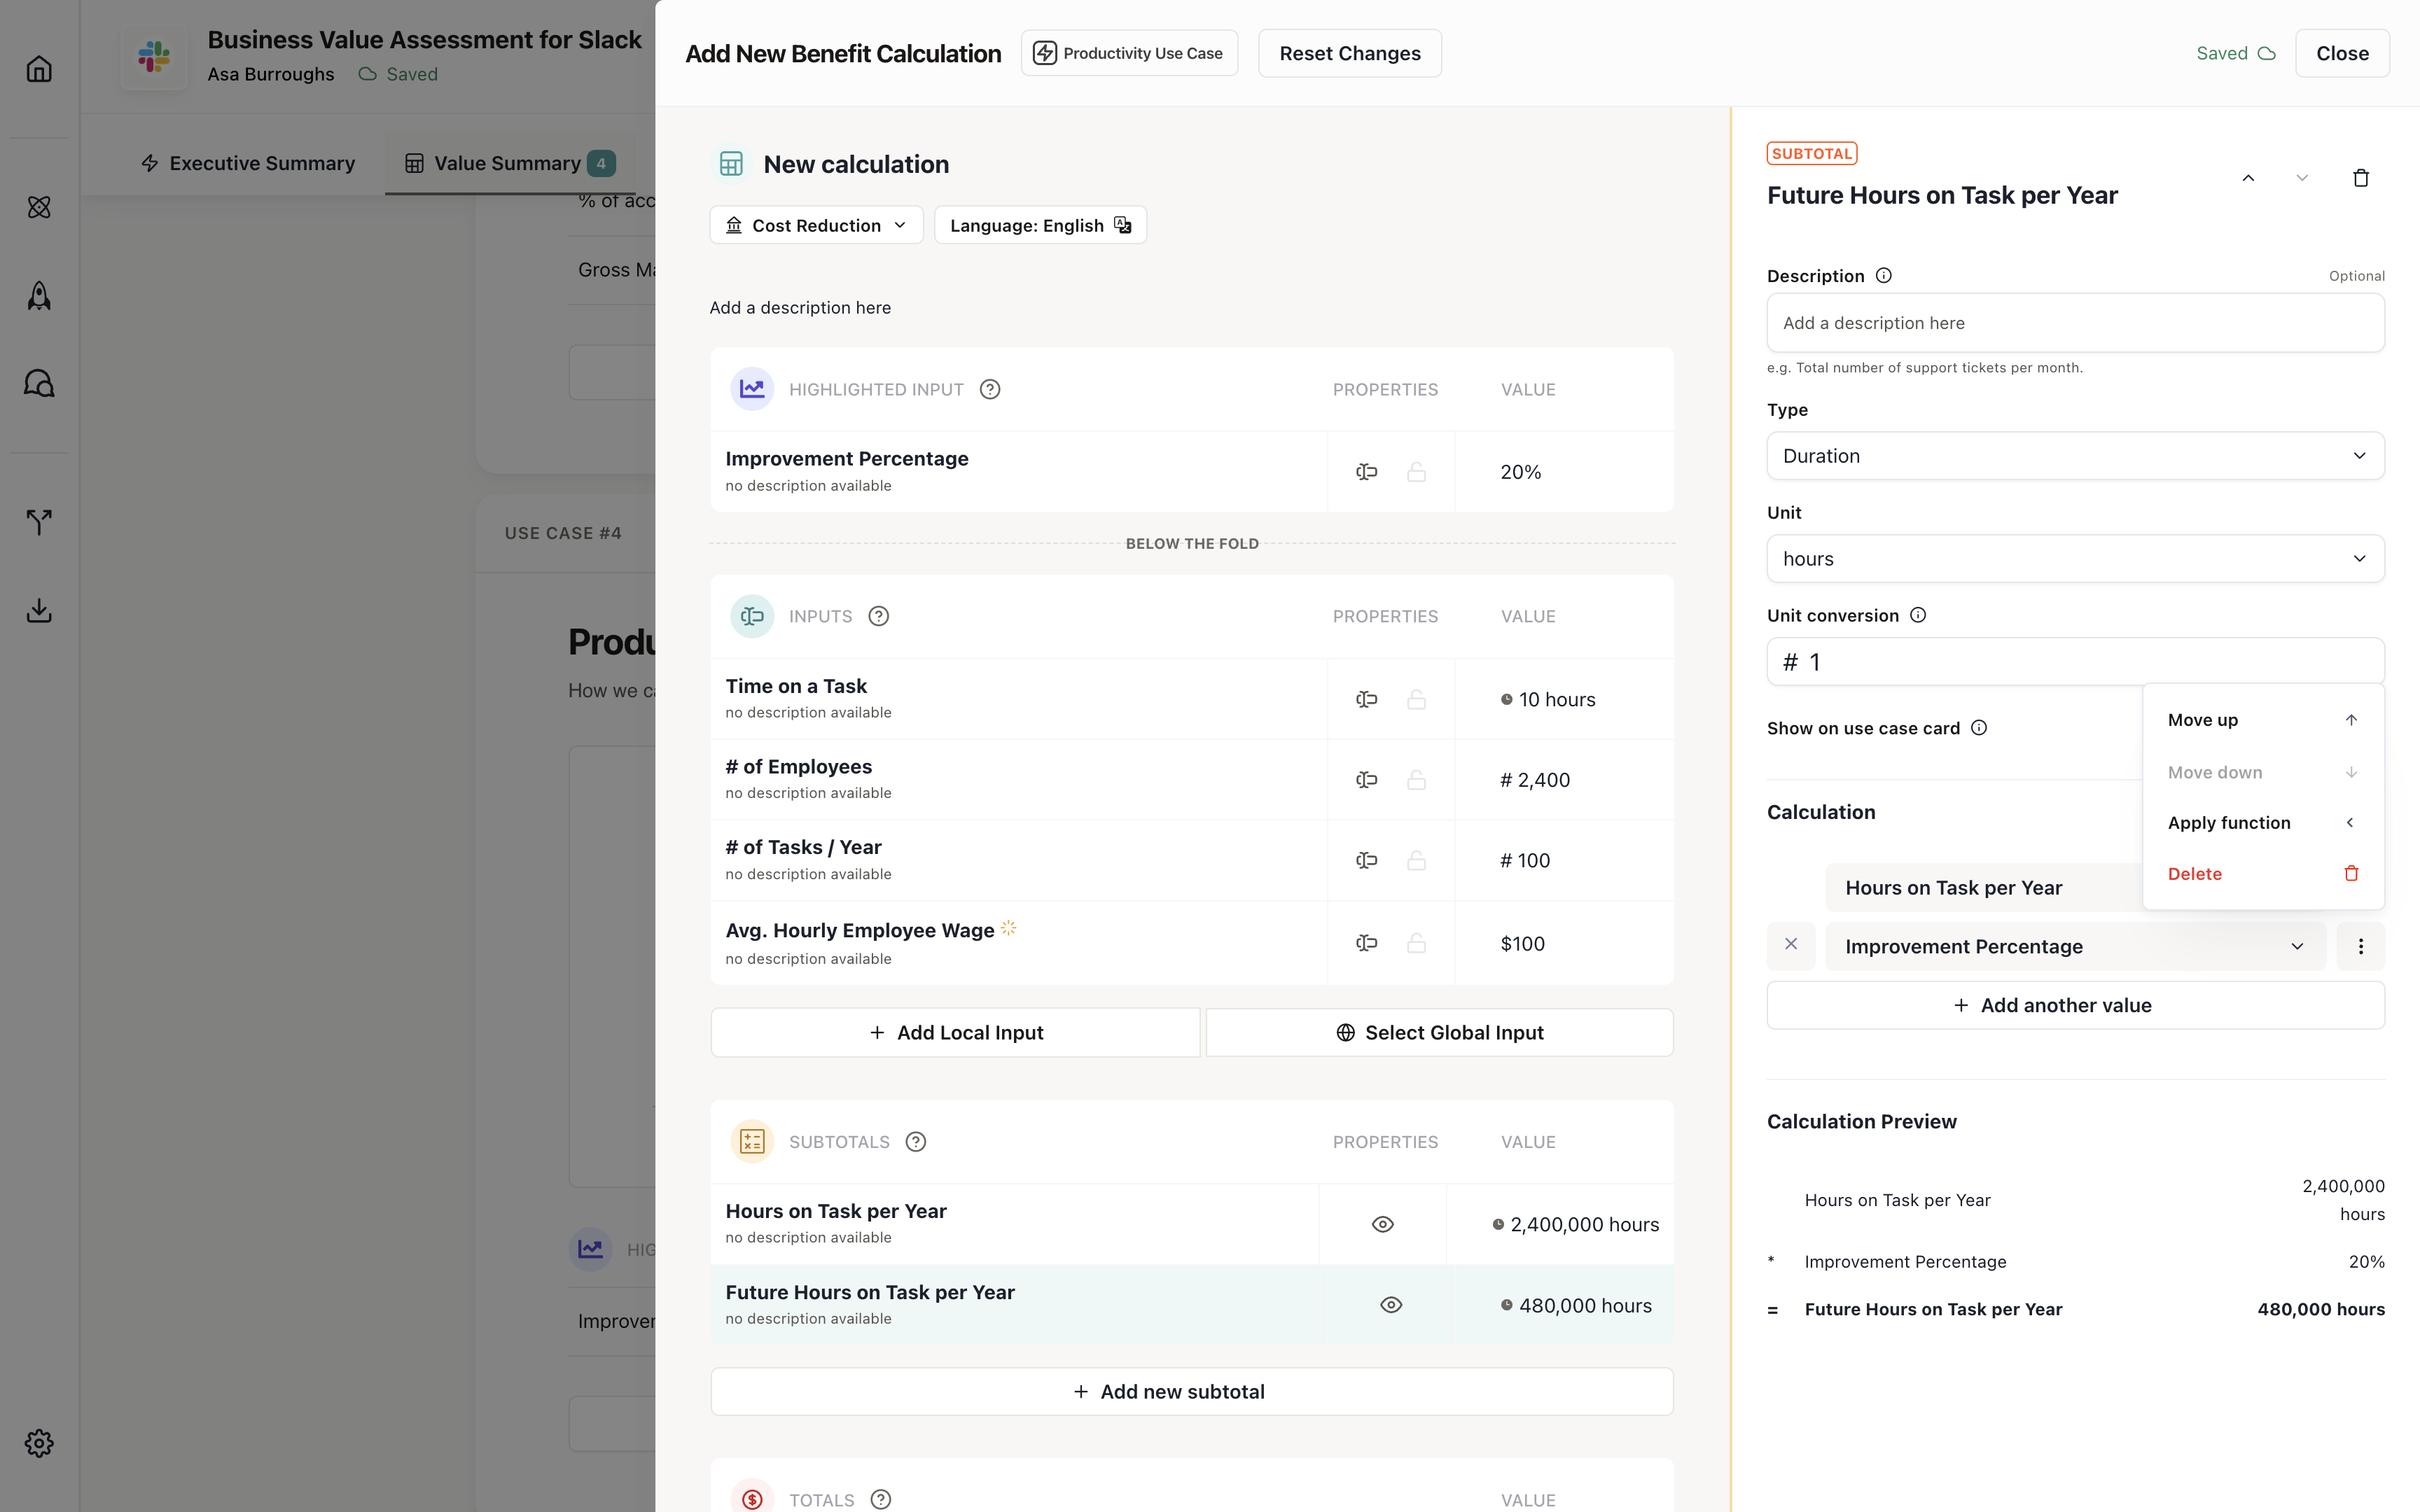
Second subtotal: Annual hours (future)
This applies the improvement percentage to show how many hours will be spent after your solution.- Click Add Subtotal
- Name: “Annual Hours (Future)”
- Build the formula:
- Multiply: Annual Hours (Current) × (1 - Improvement %)
- Formula:
Annual Hours (Current) × (1 - Improvement %)
We use
(1 - Improvement %) because a 30% improvement means we do 70% of the original work. If your improvement
percentage represents efficiency gain, you might structure this differently.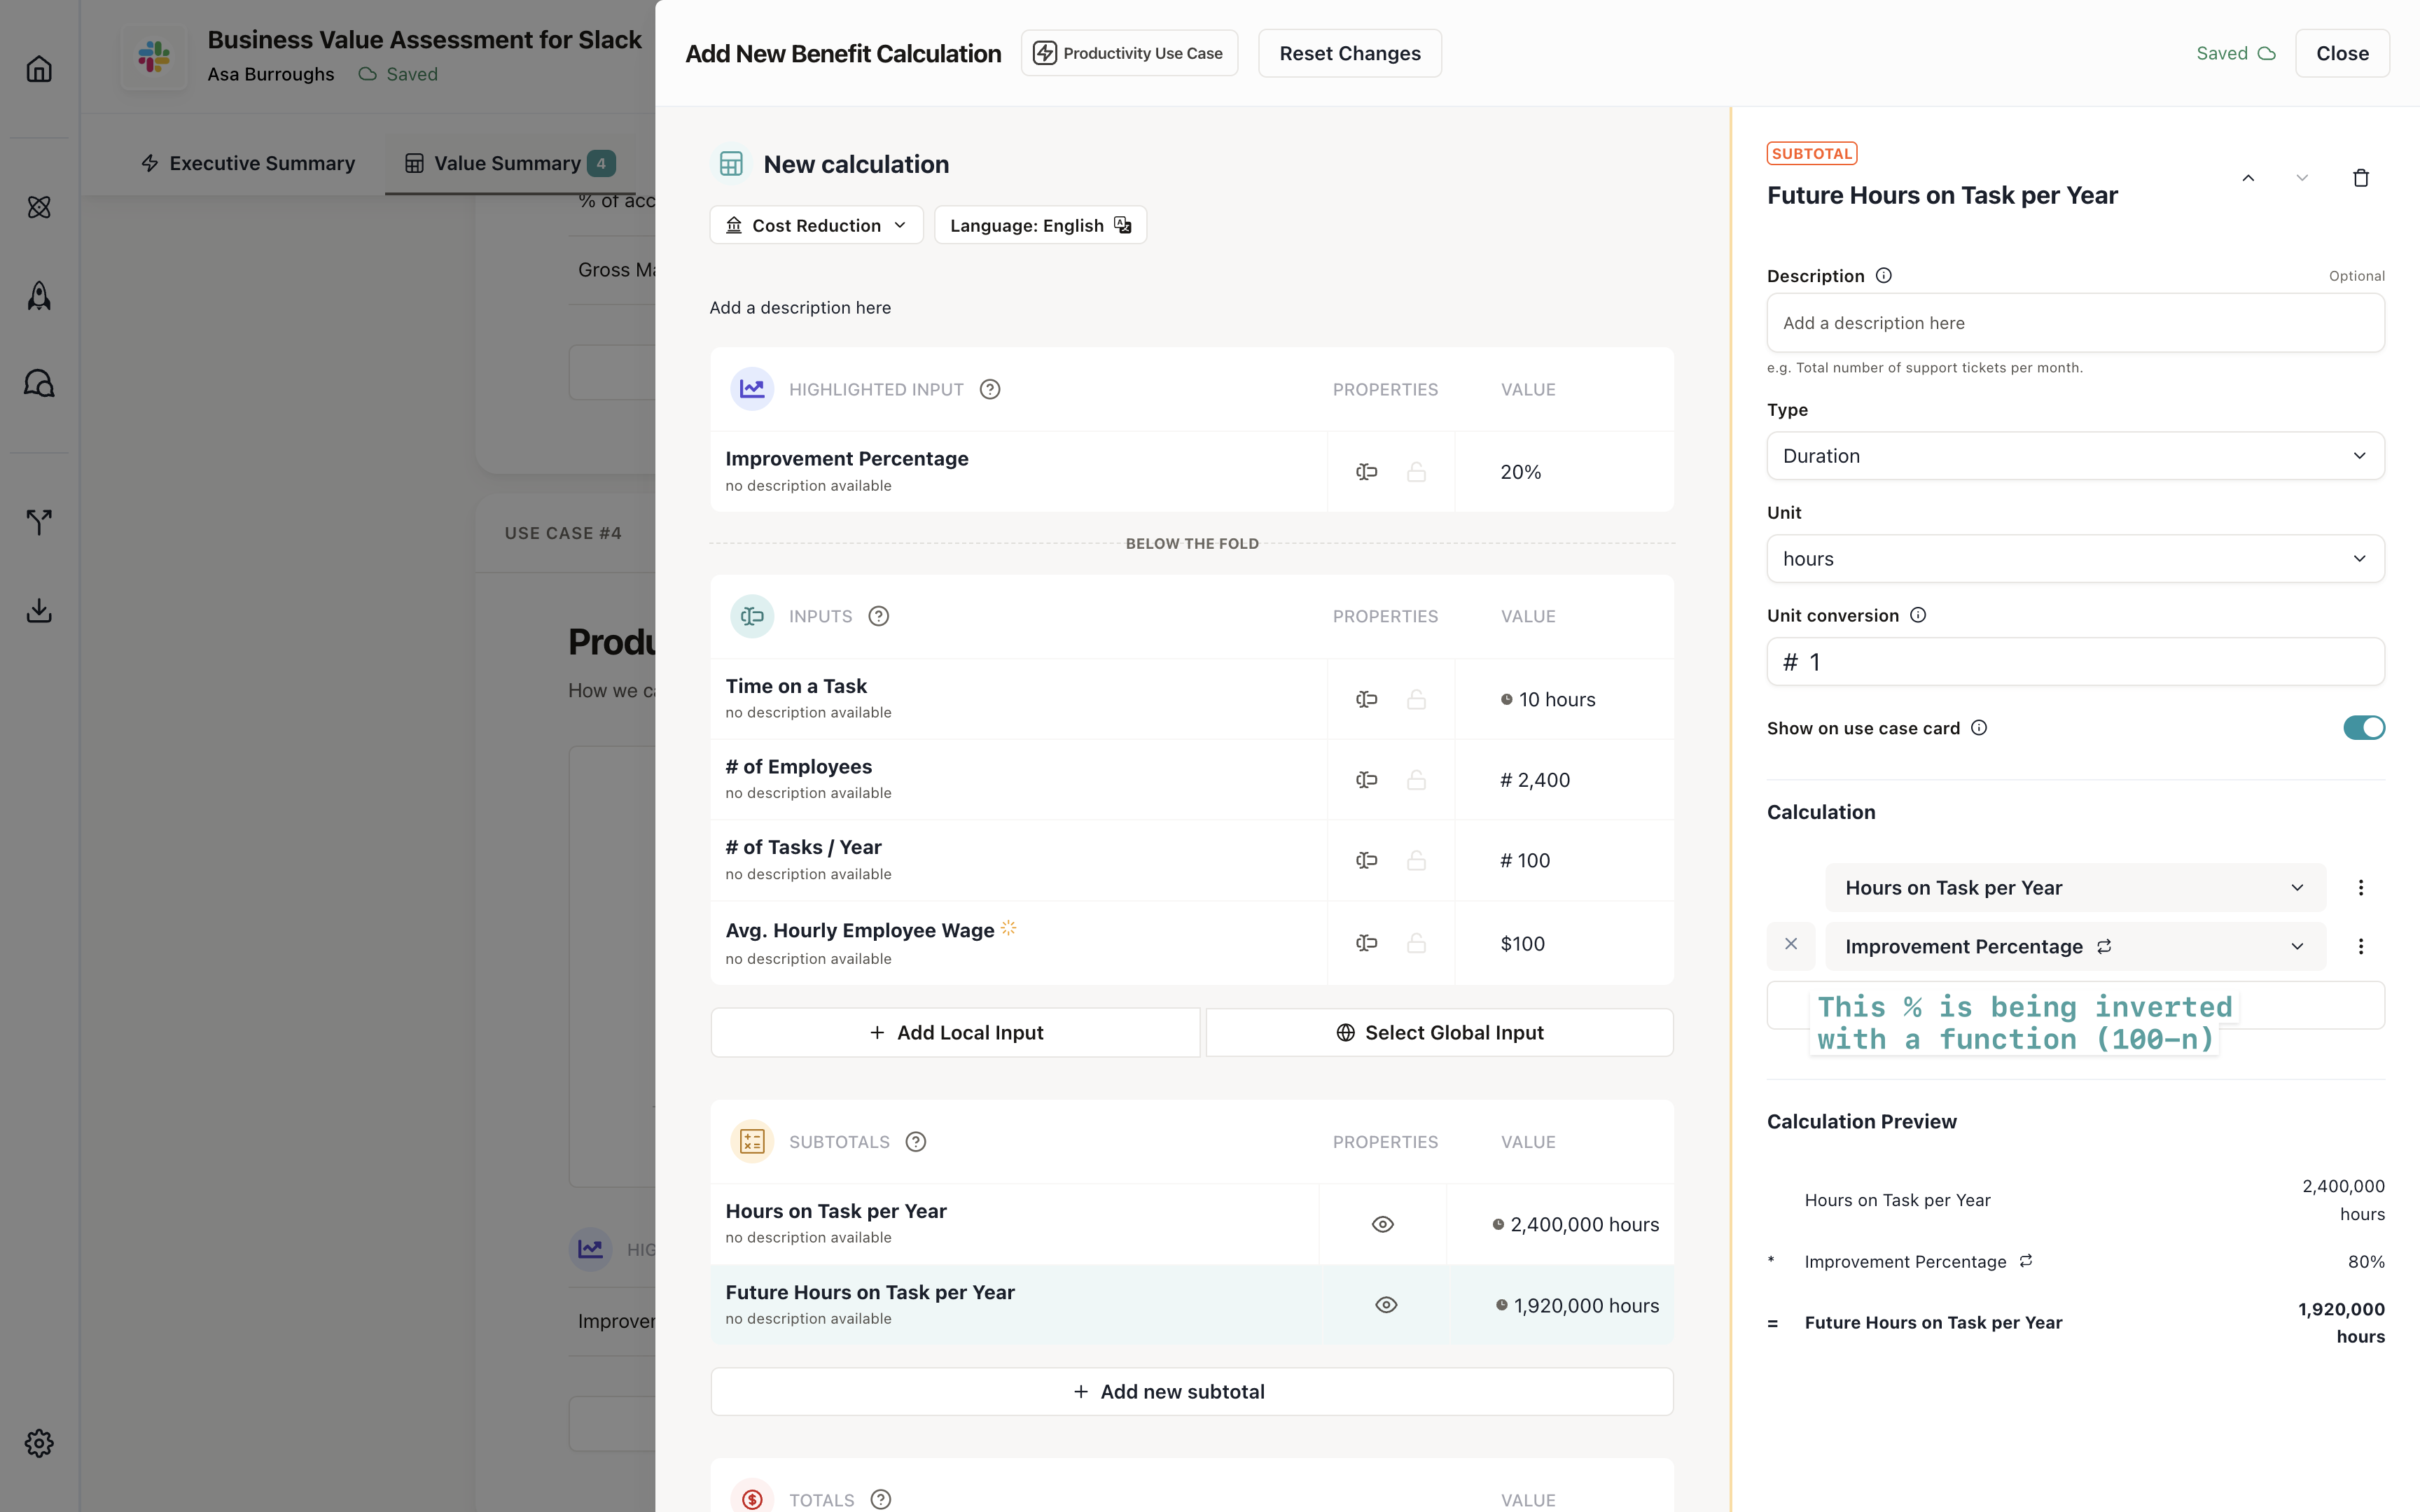
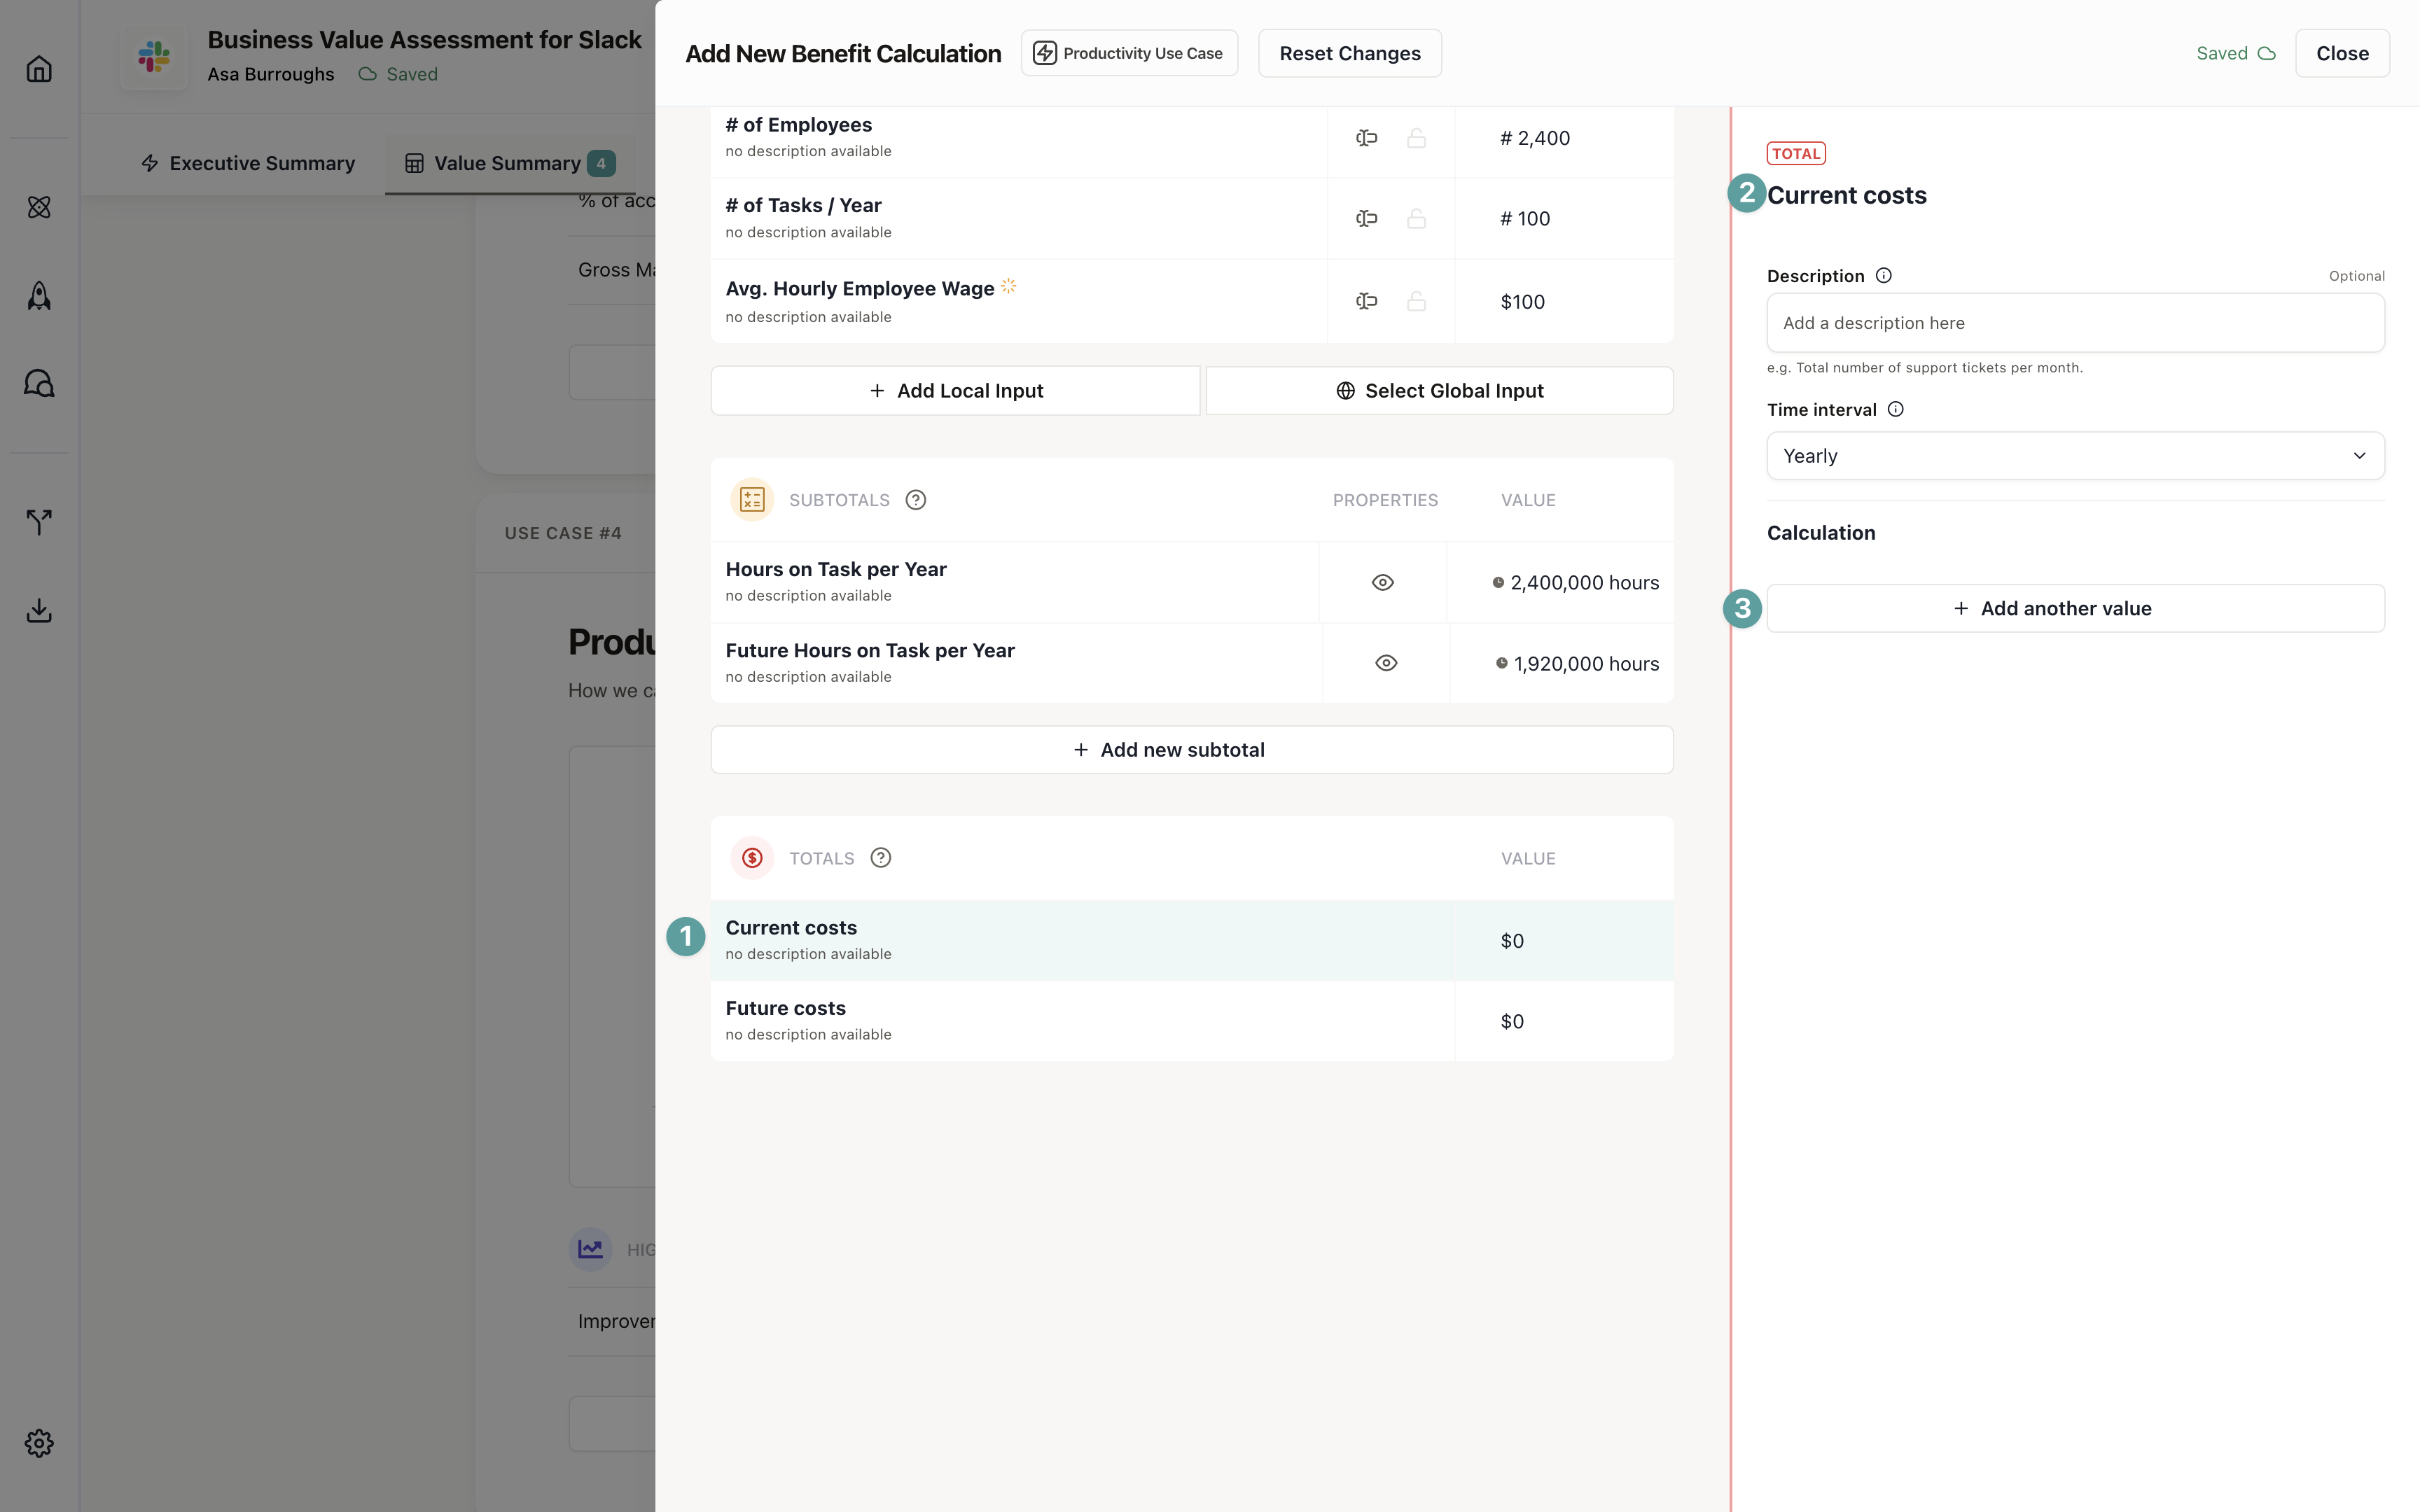
Configure your totals
Totals are the final values that appear prominently on use case cards. For a Cost Reduction calculation, you typically have two totals: current cost and future cost.First total: Current cost
This shows the current annual cost of the task.- Click Add Total
- Name: “Current Cost”
- Build the formula:
- Multiply: Annual Hours (Current) × Average Hourly Rate
- Formula:
Annual Hours (Current) × Average Hourly Rate
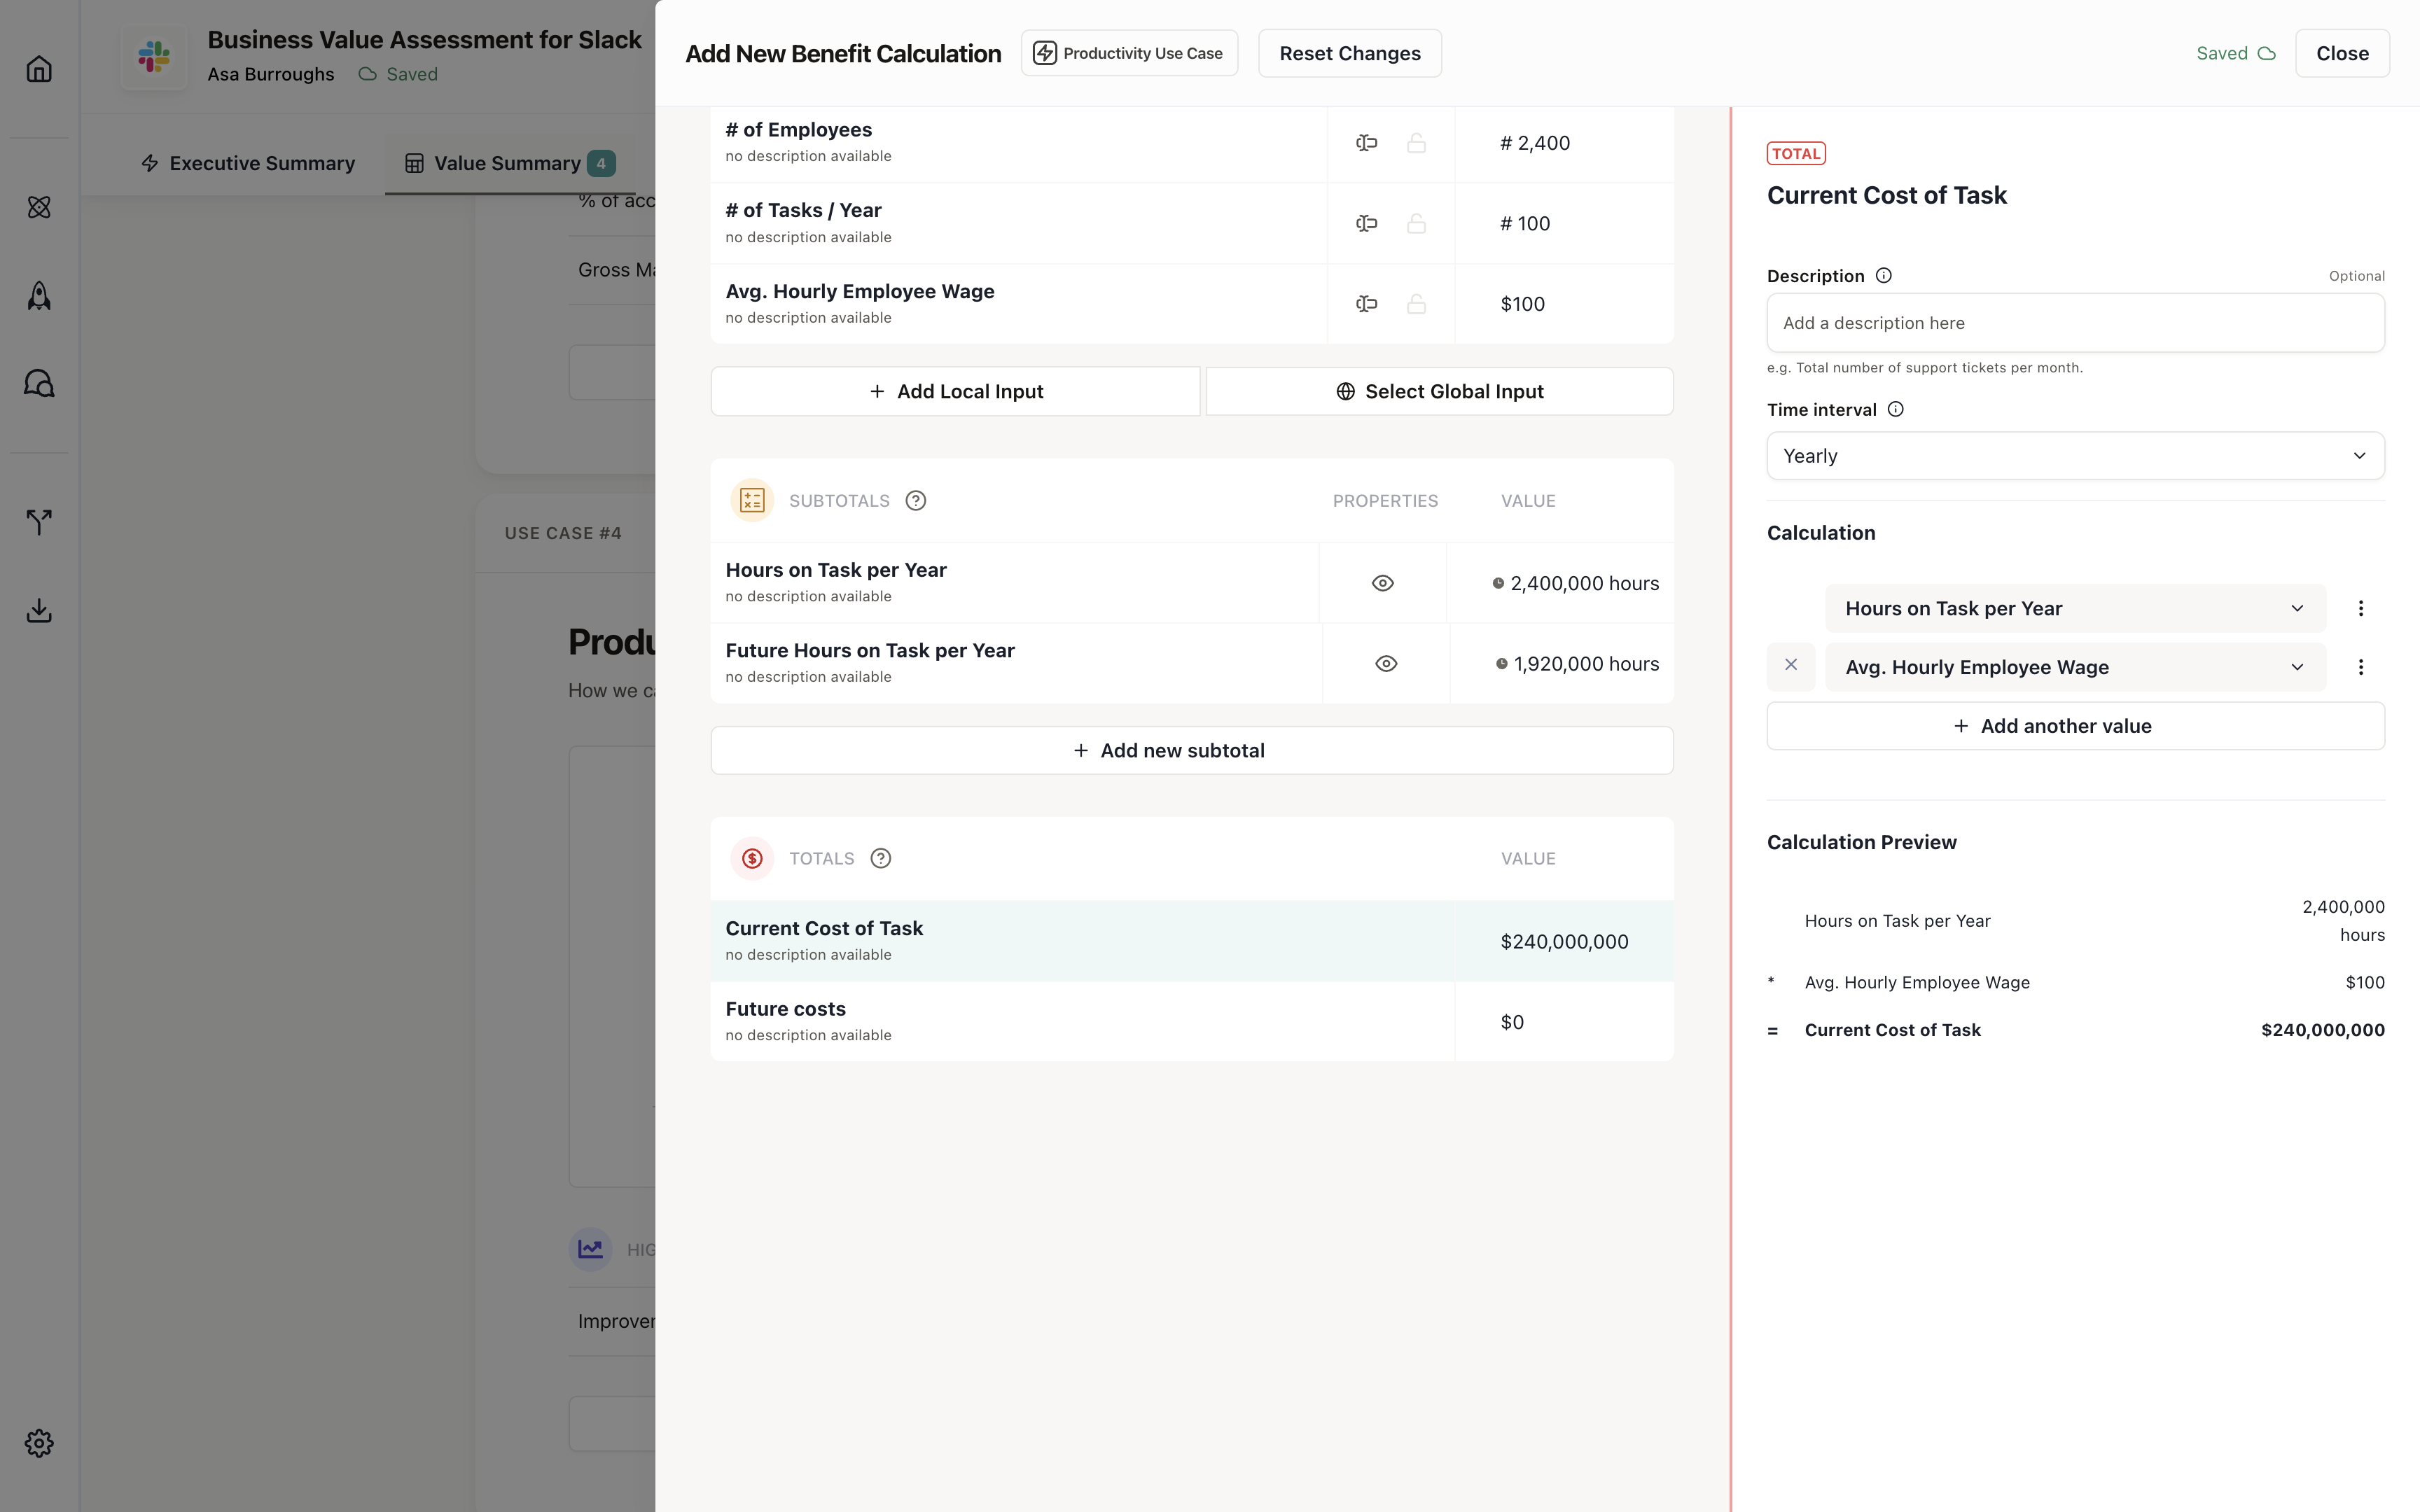
Second total: Future cost
This shows the future annual cost after your improvement.- Click Add Total
- Name: “Future Cost”
- Build the formula:
- Multiply: Annual Hours (Future) × Average Hourly Rate
- Formula:
Annual Hours (Future) × Average Hourly Rate

Your calculation is complete! The difference between Current Cost and Future Cost shows the annual savings.
What you’ve built
Your calculation now:- Captures the right inputs: Time per task, frequency, employee count, and hourly rate
- Shows improvement impact: The highlighted improvement percentage drives the savings
- Calculates intermediate values: Subtotals break down the math into understandable steps
- Displays clear outcomes: Two totals show current vs. future costs side-by-side
Learn more about building use cases and how calculations
work in business cases.