- Dashboards built from configurable tiles, organized into views (tabs) you can browse and customize.
- The Value Analytics Agent — an AI agent that answers natural-language questions about your data and generates charts or tables on demand.
 Use whichever fits the moment: open a dashboard for a quick read on the metrics you watch every week, or ask the agent a one-off question when you want something specific.
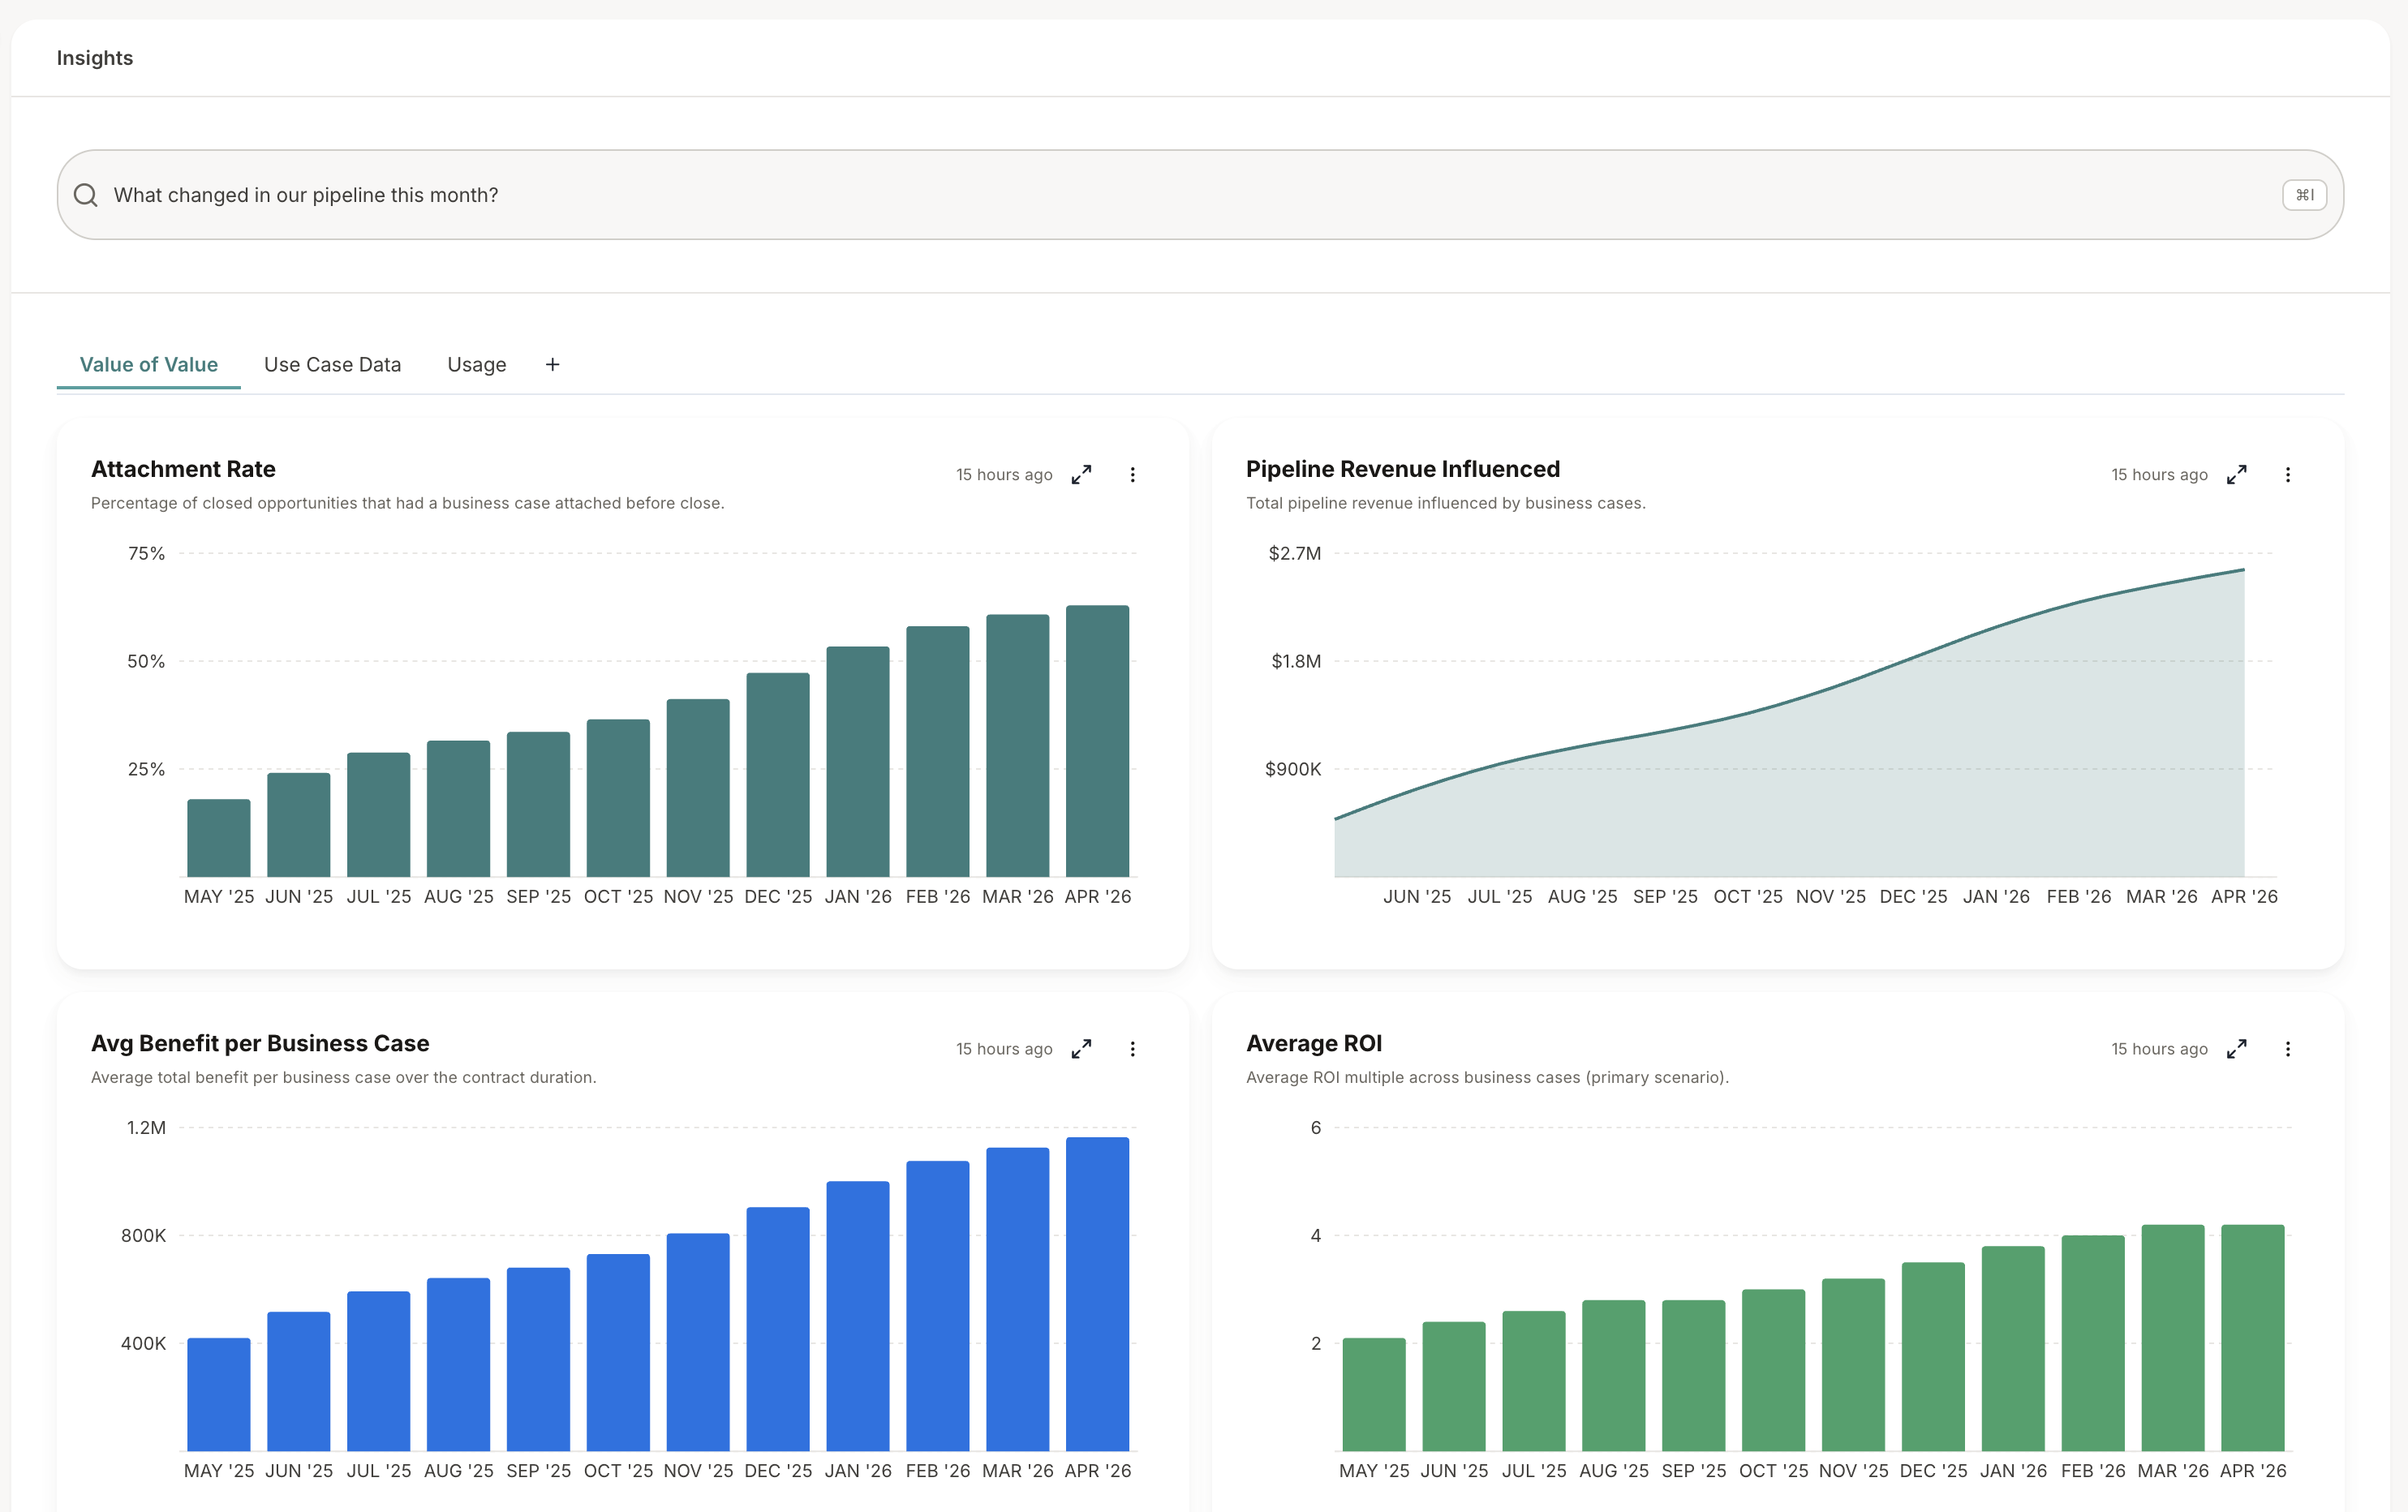
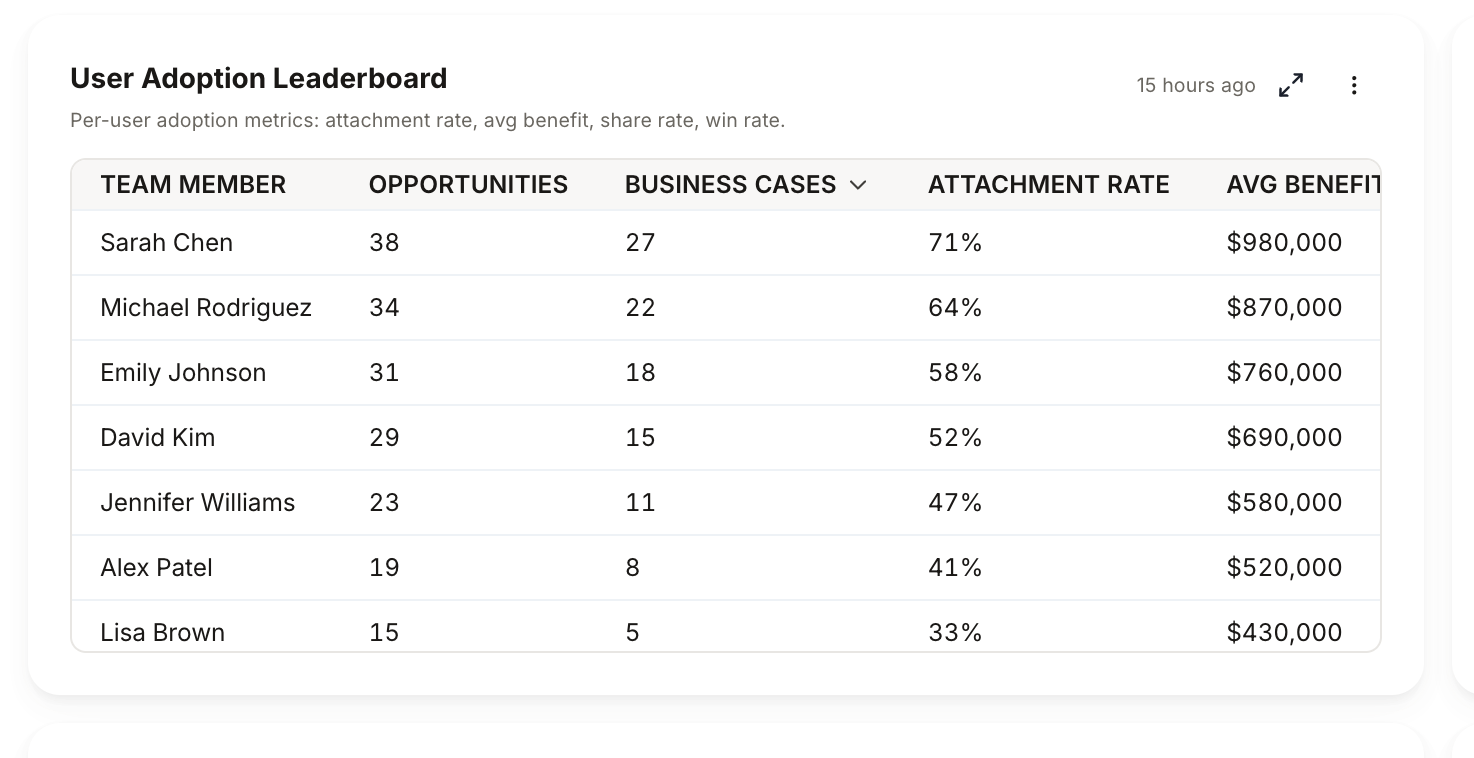
Each dashboard is built from tiles — self-contained charts or tables that refresh on demand and can be expanded for a closer look.
Use whichever fits the moment: open a dashboard for a quick read on the metrics you watch every week, or ask the agent a one-off question when you want something specific.
Each dashboard is built from tiles — self-contained charts or tables that refresh on demand and can be expanded for a closer look.
Where to start
Views & Tiles
Browse pre-built dashboards, customize layouts, create your own tiles, and manage views for your team.
Value Analytics Agent
Ask natural-language questions about your data. The agent runs the queries, builds the chart, and explains the result.
Who can do what
- Everyone with access to Insights can switch views, view tiles, refresh data, export charts, start conversations on tiles, and use the agent.
- Admins can add and remove tiles, edit tile titles and descriptions, reorder tiles, and create, rename, delete, or reorder views.
Related
- Level of Detail — a separate signal that scores the maturity of each business case and helps you coach effectively.